| Title |
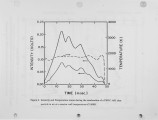
Measurement of Temperature-Time Histories of Burning Single Coal Char Particles |
| Creator |
Sahu, Ranajit; Flagan, Richard C. |
| Publisher |
University of Utah |
| Date |
1988 |
| Spatial Coverage |
presented at Pittsburgh, Pennsylvania |
| Abstract |
Complete temperature-time histories of single burning char particles were measured with a two-color pyrometer using wavelengths in the near infra-red. The char particles were in the size range 40-130JLm. They were made from a US high volatile bituminous coal (PSOC 1451). The coal was ground to a size of about 60JLm and then pyrolyzed in nitrogen at 1600K. The char particles were burned in a laminar flow dro~tube furnace that was electrically heated. In the first part of the present paper we discuss the theoretical basis and the algorithm for getting accurate particle temperatures by measuring the emitted radiation in two different wavelength bands. Key assumptions that have to be made in the process are discussed and the sensitivity of the method is calculated. Based on reasonable assuptions it is shown that the accuracy of the method is around 1%, provided that calibration is accurately done. The next part of the paper consists of analyses of various temperature time traces. Several important aspects of single particle combustion are highlighted. The surprising particle-particle combustion variability that is observed is analysed. This variability is mainly due to variations in the particle size, shape, and reactivity. Particle tumbling during burning is another interesting phenomena that is clearly indicated in some traces. Finally, contrary to the common modeling assumption of uniform particle combustion, it is seen from many particle traces that, in the initial stages, combustion on the particle surface is nonuniform. This observation has major ramifications on modelling and data interpretation. |
| Type |
Text |
| Format |
application/pdf |
| Language |
eng |
| Rights |
This material may be protected by copyright. Permission required for use in any form. For further information please contact the American Flame Research Committee. |
| Conversion Specifications |
Original scanned with Canon EOS-1Ds Mark II, 16.7 megapixel digital camera and saved as 400 ppi uncompressed TIFF, 16 bit depth. |
| Scanning Technician |
Cliodhna Davis |
| ARK |
ark:/87278/s6dv1nfx |
| Setname |
uu_afrc |
| ID |
4721 |
| Reference URL |
https://collections.lib.utah.edu/ark:/87278/s6dv1nfx |


