| Title |
Assessment of Incinerator Emissions During Operational Transients |
| Creator |
Trenholm, Andrew R. |
| Publisher |
University of Utah |
| Date |
1987 |
| Spatial Coverage |
presented at Palm Springs, California |
| Abstract |
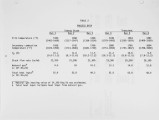
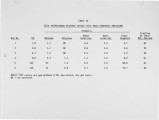
The Resource Conservation and Recovery Act (RCRA) was enacted in 1976 and amended in 1984 by the Hazardous and Solid Waste Amendments (HSWA) to address problems of toxic and hazardous waste disposal. Commensurate with these statues, the Environmental Protection Agency (EPA) regards incineration as one of the principal technologies for the safe disposal of wastes. Pursuant to RCRA the EPA promulgated the standards for hazardous waste incinerators in January 1981 that require a destruction and removal efficiency (ORE) of 99.99 percent for each principal organic hazardous constituent (POHC) designated for each waste feed. This standard and past studies of hazardous waste incinerators have primarily examined the performance of combustion systems relative to ORE for RCRA Appendix VIII compounds in the waste feed. These earlier studies demonstrated that in general most facilities performed quite well relative to the ORE. However, subsequent review by the EPAIs Science Advisory Board (SAB)2 raised questions about additional Appendix VIII or non-Appendix VIII constituents that were not identified in the earlier tests and might be emitted from combustion of hazardous waste. These other organic compounds present in the stack gas are commonly referred to as products of incomplete combustion (PIC). The total of all POHCs and PICs that were identified in incinerator stack gases during the earlier studies was typically less than 10 percent of the total organic emissions. To address the SAB question, Midwest Research Institute (MRI) was contracted by the Hazardous Waste Engineering Research Laboratory, EPA, Cincinnati, Ohio, to measure all organic emissions from a hazardous waste incinerator to the extent possible. This paper presents results of measurements of stack emissions from this study. |
| Type |
Text |
| Format |
application/pdf |
| Language |
eng |
| Rights |
This material may be protected by copyright. Permission required for use in any form. For further information please contact the American Flame Research Committee. |
| Conversion Specifications |
Original scanned with Canon EOS-1Ds Mark II, 16.7 megapixel digital camera and saved as 400 ppi uncompressed TIFF, 16 bit depth. |
| Scanning Technician |
Cliodhna Davis |
| ARK |
ark:/87278/s6pg1v99 |
| Setname |
uu_afrc |
| ID |
3981 |
| Reference URL |
https://collections.lib.utah.edu/ark:/87278/s6pg1v99 |


