| Title |
Fuel Staging for Pulverized Coal Furnace NOx Control |
| Creator |
Kelly, J. T.; Pam, R. L.; Suttman, S. T. |
| Publisher |
University of Utah |
| Date |
1982 |
| Spatial Coverage |
presented at Newport Beach, California |
| Abstract |
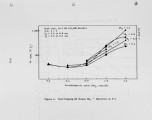
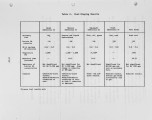
A 16.1 kW idealized subscale combustor was used to define the NOx emission control benefits of fuel staging. N0X control is achieved by injecting coal, as well as combustion air, at two locations in the combustor. The NOx and combustion product gases from the first-stage flame are mixed with fuel and air in the second stage and reburned. The fuel fragments, fuel nitrogen components, soot and char produced by the reburning interact with the previously formed NC^, reducing it to low levels within a fraction of a second. This combustion modification approach has lowered NOx by over 70 percent from baseline levels. Current test results show that second-stage stoichiometry is a dominant process variable, and that effective N0X reduction requires that the second stage be operated fuel rich. First- and third-stage stoichiometries and fuel fraction injected into the second stage were less important to the process, as long as the second stage was operated under fuel-rich conditions. Based on the test results of this study, process variable regimes were identified where fuel staging has a distinct advantage in controlling NOx emissions over classical staging. These are cases where the first stage is operated fuel lean and the second stage is operated fuel rich. |
| Type |
Text |
| Format |
application/pdf |
| Language |
eng |
| Rights |
This material may be protected by copyright. Permission required for use in any form. For further information please contact the American Flame Research Committee. |
| Conversion Specifications |
Original scanned with Canon EOS-1Ds Mark II, 16.7 megapixel digital camera and saved as 400 ppi uncompressed TIFF, 16 bit depth. |
| Scanning Technician |
Cliodhna Davis |
| ARK |
ark:/87278/s6gb26k5 |
| Setname |
uu_afrc |
| ID |
2982 |
| Reference URL |
https://collections.lib.utah.edu/ark:/87278/s6gb26k5 |


