| Title |
Cars Measurements in Coal Combustion Environments: Practical Considerations |
| Creator |
Beiting, E. J. |
| Publisher |
University of Utah |
| Date |
1985 |
| Spatial Coverage |
presented at Livermore, California |
| Abstract |
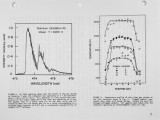
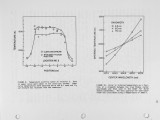
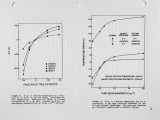
Multiplex coherent anti-Stokes Raman spectra (CARS) of nitrogen were recorded in an environment that simulates the post-magnet gas stream of a coal-fired MHD generator. The presence of coal fly ash and potassium seed created a weakly ionized, highly luminous medium with a high number density of relatively large (1-50 nm) diameter particles. Maximum temperatures of 2500 K were measured with a spatial resolution of 5 mm. The precision optical alignment necessary for folded BOXCARS phasematching was maintained for the long distances (>10 m) necessary to route the laser beams from the CARS instruments to the combustion facility. The increased luminosity caused by the injection of potassium seed did not impede the recovery of good quality spectra. The coal fly ash particles precipitated laser induced breakdown which, in turn, led to the generation of a coherent interference with N2 spectra. Techniques to overcome this problem are discussed. A nonlinear least-squares fitting computer program was used to systematically examine the error in inferred temperatures caused by uncertainties in the parameters used in the Kataoka-Teets algorithm employed to reduce the data. The accuracy of the temperature measurements are estimated to be +-3 percent. |
| Type |
Text |
| Format |
application/pdf |
| Language |
eng |
| Rights |
This material may be protected by copyright. Permission required for use in any form. For further information please contact the American Flame Research Committee. |
| Conversion Specifications |
Original scanned with Canon EOS-1Ds Mark II, 16.7 megapixel digital camera and saved as 400 ppi uncompressed TIFF, 16 bit depth. |
| Scanning Technician |
Cliodhna Davis |
| ARK |
ark:/87278/s6m61nsq |
| Setname |
uu_afrc |
| ID |
2081 |
| Reference URL |
https://collections.lib.utah.edu/ark:/87278/s6m61nsq |


