| Title |
Fluidized Bed Combustion of Feedlot Manure |
| Creator |
Annamalai, K.; Sweeten, J.; Madan, A.; Park, J. |
| Publisher |
University of Utah |
| Date |
1984 |
| Spatial Coverage |
Tulsa, Oklahoma |
| Abstract |
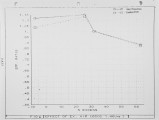
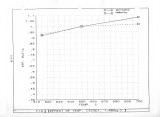
Livestock and poultry in confined feeding operations produce 52 million dry tons of economically recoverable manure each year. These animal wastes must be properly managed to prevent water and air pollution problems. Since the cost of transportation precludes the sale of manure as fertilizer, an alternative way of disposing the manure is to use the manure as a fuel for supplying the energy needs of feedlots. While most of the previous research deal t with pyrolysis and gasification with partial oxidation, the present research deals with direct combustion of manure. Under the present research program, thermophysical and pyrolysis data were generated for the feedlot manure. Experiments were carried out for the direct combustion of manure in fluidized bed combustor (FBC). Data was obtained for the composition of products and for the gasification and oxidation efficiencies. The effects of excess air, bed temperature and fluidization velocity on the performance of FBC were investigated. Because of higher volatile content of manure compared to coal, the CO content at bed temperature of 700 C is of the order of 3-4% while previously published literature for coal fired FBC reveal CO is gas ofthe order of 1%. Further experiments are underway to minimize the CO content in the product gases. |
| Type |
Text |
| Format |
application/pdf |
| Language |
eng |
| Rights |
This material may be protected by copyright. Permission required for use in any form. For further information please contact the American Flame Research Committee. |
| Conversion Specifications |
Original scanned with Canon EOS-1Ds Mark II, 16.7 megapixel digital camera and saved as 400 ppi uncompressed TIFF, 16 bit depth. |
| Scanning Technician |
Cliodhna Davis |
| ARK |
ark:/87278/s6639s8x |
| Setname |
uu_afrc |
| ID |
1563 |
| Reference URL |
https://collections.lib.utah.edu/ark:/87278/s6639s8x |


