| OCR Text |
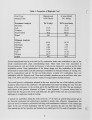
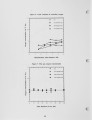
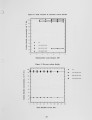
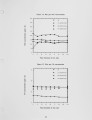
Show and radiant heat flux, like the measured values of the flame temperature (see Figure 2), should be highest for the 35/65% 0 2/C02 combustion test. 4.3 Feed mixture, flame and flue gas compositions Figure 5 shows a plot of the inlet composition of the 02/C02 combustion gas mixtures used in the trials. In all cases the inlet gas compositions, taking into consideration all gas flows in the primary, secondary and tertiary streams, was found to maintain the desired 02/C02 mixture compositions of 21/79, 28/72 and 35/65% selected for the trials. The volumetric gas compositions plotted in this figure were calculated from the flow readings monitored by the mass flow meters in the primary, secondary and tertiary inlet gas streams. A s noted in Table 2 and elsewhere in the introduction to Section 4, the volume concentration of C 0 2 and 0 2 monitored in the secondary gas stream for these trials will be different from the mean inlet compositions reported in Figure 5. Figure 6 shows the combustor axial profiles of the centre line flame oxygen concentration. The data show that centre line flame oxygen concentration increases towards the furnace exit to a value close to the excess oxygen concentration maintained in the flue gas. A s shown in Figure 7, the mean exit excess oxygen concentration in the flue gas was maintained within +/-20% of a nominal value of 5 volume %. A s expected, Figure 6 also shows that the centre line flame oxygen composition increases with an increasing concentration of oxygen in the 0 2/C02 combustion gas mixtures. However, despite higher oxygen concentrations in the 28/72 and 35/65% inlet 0 2/C02 combustion gas mixtures, the highest in-flame oxygen concentrations were measured for the pulverised coal flame burning in air. Figure 8 shows the corresponding axial profiles of the centre line flame C02 concentration. The data measured for air is at a value below 14.77% anticipated from fuel carbon burnout and dilution by nitrogen from the combustion air. Although the fuel burnout calculation and inlet feed gas dilution suggest that the in-flame C 0 2 concentrations should be less than 94.8 vol% for the 02/C02 combustion gas mixtures, the measured values are higher. In some cases, the measured inflame concentrations are higher than 1 0 0 % and could be attributed to calibration and/or resolution enors in the infra-red C 0 2 gas analyser. However, for the exit flue gas C 0 2 compositions shown in Figure 9, the measured data agree well with the 14.77 and 94.8% vol concentrations anticipated from the fuel burnout calculations for the air and 0 2/C02 combustion gas mixtures. Figure 10 shows the combustor axial profiles of the centre line NOx concentration. The data show a trend of increasing N O x concentrations with a higher oxygen concentration in the 0 2/C02 gas mixtures. Intermediate N O x values between those measured for the 28 and 3 5 % 0 2 runs were measured for the air run. Because N O x formation is strongly dependent on the flame temperature, these trends appear to mirror the trend noted for the increase in-flame temperatures (see Figure 2 and Section 4.2). The plots of the exit concentration of N O x in the flue gas shown in Figure 11 are also in general agreement with the above trends. 10 |