| Title |
Lifted Flames: A New Concept of Ultra Low NOx Combustion |
| Creator |
Motegi, Toru; Nakamura, Tsuneaki |
| Publisher |
University of Utah |
| Date |
1996 |
| Spatial Coverage |
presented at Baltimore, Maryland |
| Abstract |
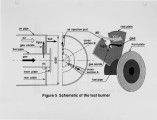
This paper describes a new concept of low NOx combustion for low temperature processes such as gas-fired boilers. The study focused on the low NOx combustion characteristics of lifted flames. A generic burner creating lifted flames was designed and tested in a watercooled experimental boiler furnace (¢ 600x2000 mm with fuel input of 480 kW). The study investigated the effect of process parameters such as the velocity of combustion air and fuel gas. The ratio of combustion air to fuel gas velocity was shown to be responsible for generating lifted flames. Once the flame was lifted, the NOx level decreased drastically, from 50-60 ppm down to 20 ppm (0% 0) at the excess air ratio of 1.1. In-flame measurement was conducted to gain a detailed understanding of the lifted flame and its low NOx characteristics. Unlike conventional low NOx burners with stabilized flames, the new burner ignited the fuel further downstream from the burner, generating lifted flames that are not stabilized by a flame stabilizer. A very large internal recirculation zone was observed in the furnace, suggesting that a large amount of flue gas recirculates back to the flame zone. The degree of self-induced flue gas recirculation was estimated. A large amount of flue gas was recirculated and entrained in the combustion air and fuel gas stream before the ignition, resulting in ultra-low NOx emission. The burner makes good use of the effect of self induced flue gas recirculation. This new concept of lifted flames is expected to be applicable to a wide variety of combustion systems. |
| Type |
Text |
| Format |
application/pdf |
| Language |
eng |
| Rights |
This material may be protected by copyright. Permission required for use in any form. For further information please contact the American Flame Research Committee. |
| Conversion Specifications |
Original scanned with Canon EOS-1Ds Mark II, 16.7 megapixel digital camera and saved as 400 ppi uncompressed TIFF, 16 bit depth. |
| Scanning Technician |
Cliodhna Davis |
| ARK |
ark:/87278/s6h997tb |
| Setname |
uu_afrc |
| ID |
12763 |
| Reference URL |
https://collections.lib.utah.edu/ark:/87278/s6h997tb |


