| Title |
Scaling Laws for NOx Emission Performance of Burners and Furnaces from 30kW to 12MW |
| Creator |
Hsieh, T.-C. Adrian; Dahm, Werner J.A.; Driscoll, James F. |
| Publisher |
University of Utah |
| Date |
1996 |
| Spatial Coverage |
presented at Baltimore, Maryland |
| Abstract |
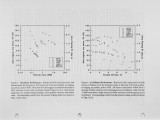
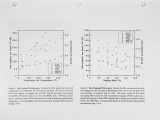
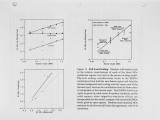
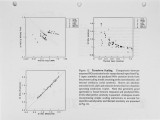
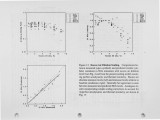
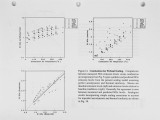
A general burner and furnace scaling methodology is presented, together with the resulting scaling model for NOx emissions performance of a broad class of swirl stabilized industrial gas burners. The model is based on results from burner scaling experiments on a generic gas burner and furnace design at five different scales having near-uniform geometric, aerodynamic, and thermal similarity and uniform measurement protocols. These provide the first NOx scaling data over the range of thermal scales from 30 kW to 12 MW, including input-output measurements as well as detailed in-flame measurements of NO, NOx, CO, O2, unburned hydrocarbons, temperature, and velocities at each scale. The in-flame measurements allow identification of key sources of NOx production. The underlying physics of these NOx sources lead to scaling laws for their respective contributions to the overall NOx emissions performance. It is found that the relative importance of each source depends on the burner scale and operating conditions. Simple furnace residence time scaling is shown to be largely irrelevant, with NOx emissions instead being largely controlled by scaling of the near-burner region. The scalings for these NOx sources are combined in a comprehensive scaling model for NOx emission performance. Results from the scaling model show good agreement with experimental data at all burner scales and over the entire range of turndown, staging, preheat, and excess air dilution, with correlations generally exceeding 90%. The scaling model permits design trade-off assessments for a broad class of burners and furnaces, and allows performance of full industrial scale burners and furnaces of this type to be inferred from results of small scale tests. |
| Type |
Text |
| Format |
application/pdf |
| Language |
eng |
| Rights |
This material may be protected by copyright. Permission required for use in any form. For further information please contact the American Flame Research Committee. |
| Conversion Specifications |
Original scanned with Canon EOS-1Ds Mark II, 16.7 megapixel digital camera and saved as 400 ppi uncompressed TIFF, 16 bit depth. |
| Scanning Technician |
Cliodhna Davis |
| ARK |
ark:/87278/s6377cbj |
| Setname |
uu_afrc |
| ID |
12405 |
| Reference URL |
https://collections.lib.utah.edu/ark:/87278/s6377cbj |


