| Title |
Fuel-Lean Gas Reburn (FLGR) Technology for Achieving NOx Emissions Compliance Application to a Tangentially-Fired Boiler |
| Creator |
Frederiksen, Richard D.; Dahm, Werner J.A.; Tryggvason, Gretar; Breen, Bernard P.; Glickert, Roger; Urich, Joseph A.; Pratapas, John M.; Serauskas, Robert V. |
| Publisher |
University of Utah |
| Date |
1998 |
| Spatial Coverage |
presented at Maui, Hawaii |
| Abstract |
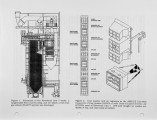
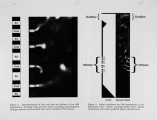
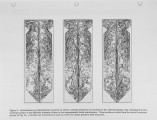
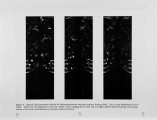
The application of fuel-lean gas reburn (FLGR) technology for NOx emissions reduction from a tangentially-fired coal-burning utility boiler is described. Design of the FLGR system involved a combination of prior field experience with the technology in other utility boiler designs, together with advanced LIM-based simulations of the injected gas mixing and reaction processes within the boiler. Parametric simulations were conducted to determine an initial FLGR system design for the boiler. Initial testing of the system performance showed higher than expected CO emissions at all boiler loads. The origin of these elevated CO levels was traced to interactions between the injected gas and the coal burnout process that are specific to tangentially-fired boiler designs employing close-coupled overfire air. Modifications to the original F L GR system were developed that led to reduced interactions and thus to significantly lower CO emissions. |
| Type |
Text |
| Format |
application/pdf |
| Language |
eng |
| Rights |
This material may be protected by copyright. Permission required for use in any form. For further information please contact the American Flame Research Committee. |
| Conversion Specifications |
Original scanned with Canon EOS-1Ds Mark II, 16.7 megapixel digital camera and saved as 400 ppi uncompressed TIFF, 16 bit depth. |
| Scanning Technician |
Cliodhna Davis |
| ARK |
ark:/87278/s6xw4nf2 |
| Setname |
uu_afrc |
| ID |
11492 |
| Reference URL |
https://collections.lib.utah.edu/ark:/87278/s6xw4nf2 |


