| OCR Text |
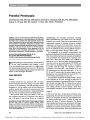
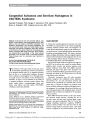
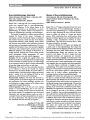
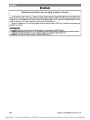
Show A ‘‘First Cut'' at Interpreting Brain MRI Signal Intensities: What's White, What's Black, and What's Gray Hemant Parmar, MD, Jonathan D. Trobe, MD Abstract: We propose that a simple but reasonable initial interpretation of brain and spinal cord MRI can be made by considering whether signal intensity is white or black or gray on precontrast T1-weighted and T2-weighted pulse sequences. We have formulated this task as a 2 3 2 table. Journal of Neuro-Ophthalmology 2010;30:91-93 doi: 10.1097/WNO.0b013e3181c95897 2010 by North American Neuro-Ophthalmology Society MRI interpretation depends chiefly on locating and characterizing signal abnormalities and deciding what alterations in tissue are causing these abnormalities. Much of this interpretation depends on MRI signal intensities, which range from very high (‘‘bright'' or ‘‘white'') to very low (‘‘dark'' or ‘‘black''). The changes in signal intensity are based on tissue features and technical parameters used to image these tissues. Many pulse sequences are used to generate MRI signals, but conven-tional T1 and T2 weighted images (abbreviated here as T1 and T2) remain the most used. So MRI interpretation really comes down to what causes tissues and their lesions to look white or black or gray. We propose that a ‘‘first cut'' at MRI interpretation can be formulated as a 2 3 2 table (Fig. 1) that compares the precontrast (noncontrast) T1 and the T2 signal intensities in relation to gray matter. Tissues that appear in this table have either white or black signal intensities. BLACK ON PRECONTRAST T1, WHITE ON T2 Most pathologic conditions of brain and spinal cord parenchyma produce this combination of signal intensities, including cyst fluid, abscess, edema, encephalomalacia, demyelination, and necrosis. Normal cerebrospinal fluid (CSF) will also have this combination of signal intensities, which helps orient you to whether the pulse sequence is T1 or T2. These tissues or lesions show black T1 and white T2 signal because they contain more water than normal gray matter. The fluid attenuation inversion recovery (FLAIR) pulse sequence is a modification of T2 designed to attenuate the high signal of free-flowing fluid, allowing the T2 signal of stationary tissues to stand out. Free-flowing fluid is found in CSF, cysts, and large areas of encephalomalacia. Thus FLAIR differs from standard T2 in that the FLAIR signal intensity of these tissues will be black. The FLAIR signal intensity will remain white in the presence of excessive interstitial or intracellular water, which does not have free flow. BLACK ON PRECONTRAST T1, BLACK ON T2 This appearance is caused by air, dense calcium, cortical bone, rapidly flowing blood, dense fibrous tissue, iron, and hemosiderin (from parenchymal hemorrhage of more than one week's duration). Air, dense calcium, cortical bone, and dense fibrous tissue generate a ‘‘pitch black'' signal on T1 and T2 because they have a complete absence of mobile protons. Rapidly flowing blood generates a pitch black signal because its protons are flowing out of the scanned slice and so produce a ‘‘signal void.'' Hemosiderin and iron are strongly paramagnetic and will therefore be pitch black on T2 and less so on T1. Departments of Radiology (Neuroradiology) (HP) and Neurology (JDT) and Department of Ophthalmology and Visual Sciences (JDT), Kellogg Eye Center, University of Michigan Health System, Ann Arbor, Michigan. Address correspondence to Jonathan D. Trobe, MD, Kellogg Eye Center, 1000 Wall Street, Ann Arbor, MI 48105; E-mail: jdtrobe@ umich.edu Parmar and Trobe: J Neuro-Ophthalmol 2010; 30: 91-93 91 Opinion WHITE ON PRECONTRAST T1, BLACK ON T2 Tissue with this combination of signals is made up of melanin, intracellular methemoglobin (resulting from hemorrhage of 3-7 days duration), or fat. Fat will appear black on T2 only on spin echo T2 sequences that are not in common use today. On the newer fast or turbo spin echo sequences, fat will appear gray or white. WHITE ON PRECONTRAST T1, WHITE ON T2 This combination of signals results from extracellular methemoglobin (brain hemorrhage of 1-4 weeks dura-tion), slowly flowing blood, or fat. Fat will appear white on T2 only if the MRI has been acquired using the more current turbo/fast spin echo sequence. Because fat and extracellular methemoglobin both cause white signal on T2 and T1, fat-suppressed sequences are sometimes used to distinguish these tissues. On such pulse sequences, fat will appear black, and extracellular methe-moglobin will remain white. Slowly flowing blood, usually from venous and occasionally from arterial sources, causes white T1 and T2 signals because its protons are moving too slowly to escape capture in the scanned slice. Regarding the gray area, the MRI signal intensities of some tissues and lesions defy simple classification because they depend on concentration, cellularity (nuclear to cytoplasmic ratio), flow rate, or hemoglobin degradation state. High protein content in body fluids will reduce its ‘‘water purity'' and shift the white T2 signal toward gray and the black T1 signal toward gray. Among tumors, the higher the fibrous content, cellular density, or nuclear-cytoplasmic ratio (round blue cell tumors like lymphomas or primitive neuroectodermal tumors) are, the lower the proportion of water purity will be, and therefore the grayer the signal on T1 and T2. Dense calcium has no mobile protons and behaves like cortical bone: black on T1 and T2. Lower densities of calcium show variable and unpredictable signals. Slowly flowing blood can give rise to a variably intense signal on T1 and T2, as the protons within the blood vessels are moving at variable rates out of the scanned slice. In such cases, evaluation by magnetic resonance angiography or venography may be required. Gradient echo (T2*) images improve detection of calcification and hemosiderin, which often appear larger and blacker (‘‘blooming'') on this pulse sequence than on T1 or T2 as a result of dephasing of water protons created by differences in magnetic susceptibility. Because the gradient echo images lack a refocusing radiofrequency FIG. 1. Signal intensities of brain and spinal cord parenchymal tissues and lesions on precontrast T1 and on T2 MRI pulse sequences. *A ‘‘pitch black'' T1 and T2 signal results from a complete absence of mobile protons. **Fat appears white on T2 on modern turbo/fast spin echo sequences and black on T2 on older spin echo sequences. ***T1 signal without contrast (‘‘precontrast'' or ‘‘noncontrast''). Intravenous injection of contrast material is used with T1 pulse sequences (‘‘postcontrast'' T1). It will generate a whiter signal than that on precontrast T1 in tissues that have an especially dense arterial blood flow (‘‘high vascularity'') or in which the dye has escaped across an absent or deficient blood-brain barrier (‘‘staining''). ^Rapidly flowing blood causes a black T1 and T2 signal because the protons have escaped the scanned slice. Slowly flowing blood, usually venous, gives rise to a white T1 and T2 signal because the protons are moving too slowly to escape from the scanned slice. Opinion 92 Parmar and Trobe: J Neuro-Ophthalmol 2010; 30: 91-93 pulse, this intravoxel dephasing accumulates, making these tissues appear especially dark. The MRI signal in fungal infections is related to the amount of proteinaceous secretions and the presence of paramagnetic or ferromagnetic material within the infected material. Fungal sinusitis may result in black T1 and T2 signal, but chronic densely concentrated mucosal secretions, which may contain no mobile protons, may also produce black T1 and T2 signals. The finding of bone erosion on CT suggests aggressive fungal disease. The MRI signal from parenchymal hematoma is difficult to interpret but evolves in a predictable manner as the clot is degraded (Fig. 2). Among the complex factors responsible for signal intensity are protein concentration, red blood cell hydration status, red blood cell size and shape, hematocrit, clot formation, clot retraction, inflammatory response, and extrinsic factors such as MRI magnetic field strength and pulse sequences. The pattern of MRI signals seen in parenchymal hematoma evolution cannot be extrapolated to extraparenchymal or extracranial hematoma. FIG. 2. MRI signal in parenchymal hematoma. T1 refers to precontrast T1. Opinion Parmar and Trobe: J Neuro-Ophthalmol 2010; 30: 91-93 93 |