| OCR Text |
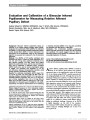
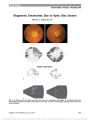
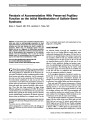
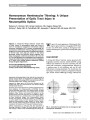
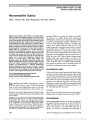
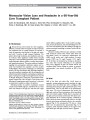
Show Evaluation and Calibration of a Binocular Infrared Pupillometer for Measuring Relative Afferent Pupillary Defect Audrey Shwe-Tin, MBChB, MRCOphth, Guy T. Smith, BSc (Hons), FRCOphth, Daniel Checketts, MSc, Ian E. Murdoch, MSc, MD, FRCOphth, Daniel Taylor, BSc (Hons), PhD Background: Binocular infrared pupillometry allows an estimate of the relative afferent pupillary defect (RAPD), designated the pupillometric RAPD (pRAPD). We calibrated the pRAPD of a commercially available pupillometer against neutral density filters (NDFs) of known attenuation. The performance of the pupillometer using its own proprietary algorithm is assessed and compared to that of alternative algorithms. Methods: The pRAPDs of 50 healthy volunteers were measured with each of 4 filters of known attenuation: 0.0, 0.3, 0.6, and 0.9 log units, positioned unilaterally in the light stimulus pathway. The filter values were plotted against the pupillometer output, and the slope and intercept were used to determine a calibration factor. Corrected pRAPD results were used to assess physiological ranges of pRAPD. The sensitivity and specificity to 0.3 log unit differences between increasing filter densities using receiver operator characteristic (ROC) curves. Results: The calibrated physiological pRAPD ranged from 0 to 0.22 log units. The area under the ROC curve for detecting unilateral simulated pRAPD of 0.3 log units, the simulated disease progression from 0.3 to 0.6 log units, and a further progression from 0.6 to 0.9 log units by NDFs was 0.99 (95% confidence interval [CI], 0.95-1.00), 0.86 (95% CI, 0.78-0.92), and 0.79 (95% CI, 0.70-0.87), respectively. The optimum discrimination was for detecting a unilateral simulated pRAPD of 0.3 log units; sensitivity and specificity was 98% (95% CI, 88%-99%). Conclusion: The commercially available pupillometer detects the RAPD induced by the NDFs with high sensitivity and specificity. The results suggest that it is best for detecting unilateral early disease but potentially useful for assessing progression of disease. Journal of Neuro-Ophthalmology 2012;32:111-115 doi: 10.1097/WNO.0b013e31823f45e5 © 2012 by North American Neuro-Ophthalmology Society Arelative afferent pupillary defect (RAPD) is caused by lesions of the anterior visual pathway that produce asymmetric input to the pupillomotor centers of the brain (1). In the clinical setting, RAPD is usually measured with the swinging flashlight test (2,3). Although this test has the advantage of being easy to perform, a number of factors can induce variability in clinical interpretation. False positives may arise from interocular differences in the state of retinal light adaptation, anisocoria, and unequal retinal illumina-tion of each eye during the swinging flashlight test (4). Kawasaki et al (4) commented that the intrinsic moment-to- moment physiological modulation of pupillomotor out-put produces dissimilar pupillary amplitude or velocity with the same light stimulus. False negatives may occur with small unforeseen RAPDs when pupillary reactions are seem-ingly equal during the first few swings of alternating light. In patients with dark irides and small or poorly reactive pupils (5), it is difficult to observe small afferent defects, adding an additional challenge. Detection of an RAPD is highly dependent on the skill of the examiner. The minimum RAPD reliably detectable by a skilled prac-titioner using the swinging flashlight test is said to be 0.3 log units (3). Ophthalmology Department (AS-T, GTS), The Great Western Hospital, Wiltshire, England; Quanticate Ltd. (DC), Hertfordshire, England; Institute of Ophthalmology (IEM), London, England; and Procyon Instruments Ltd. (DT), London, England. Dr A. Shwe-Tin received part of her research funding from the Procyon Instruments Ltd., England. Dr D. Taylor is an employee and investor of the Procyon Instruments Ltd., England. The remaining authors report no conflicts of interest. Supplemental digital content is available for this article. Direct URL citations appear in the printed text and are provided in the HTML and PDF versions of this article on the journal's Web site (www.jneuro-ophthalmology.com). Address correspondence to Guy T. Smith, BSc (Hons), FRCOphth, Ophthalmology Department, The GreatWestern Hospital, Marlborough Road, Swindon, Wiltshire SN3 6BB, England; E-mail: guytheeye@ aol.com Shwe-Tin et al: J Neuro-Ophthalmol 2012; 32: 111-115 111 Original Contribution Copyright © North American Neuro-Ophthalmology Society. Unauthorized reproduction of this article is prohibited. These shortcomings have driven researchers to find a more objective, quantifiable, and reproducible method of evaluat-ing RAPD. Laboratory-based pupillometers have been used by different investigators to measure the afferent conduction defects (4-9). Automated pupillometry eliminates the issues of examiner bias and observational inaccuracy and can pro-vide a more reliable assessment of afferent function compared to the swinging flashlight test. Investigators are able to quan-tify RAPDs of less than 0.3 log units in normal subjects using digital infrared pupillometry (6). In addition, measurement results are in a continuous scale instead of a categorical value as obtained by clinical swinging flashlight test. However, digital infrared pupillometers are not widely available. Those described in the literature are mostly research based or cus-tom built, and the stimulus parameters used were refined for each individual machine. The objective of this study is to evaluate the performance of a commercially available binocular digital infrared pupillometer, Procyon P3000 (Procyon Instruments Ltd., England), for measuring RAPD. We describe how the system is calibrated using a series of neutral density filters (NDFs) with known attenuation. This study also measures the range of physiological pupillometric RAPD (pRAPD) of healthy subjects and the sensitivity and specificity of the device to correctly detect NDF-induced unilateral pRAPDs of 0.3 log units. METHODS The study was approved by the National Research Ethics Service, United Kingdom. Subjects Fifty volunteers with healthy eyes were recruited for the study. Informed written consent was obtained from each subject prior to participation. Detailed ophthalmic, med-ical, medication, social, and family history was obtained. Each subject had a complete ophthalmologic examination. Healthy eyes were defined as having spectacle-corrected Snellen visual acuity of 20/30 or better; no eye diseases, ocular trauma, or surgery; and a normal macular and optic nerve head appearance with slitlamp biomicroscopy. Subjects were excluded if any of the following were present: diabetes, use of ocular or systemic medications known to influence the pupil movement (10), amblyopia, manifest strabismus, immobile pupils of any cause, and media opacities. Patients with abnormal findings were fol-lowed up for further evaluation. RAPD Measurement by Digital Infrared Pupillometry The Procyon P3000 is an automated dynamic binocular infrared pupillometer that records the pupil images of both eyes simultaneously. It has a spatial resolution of ±0.05 mm and a temporal resolution of ±40 milliseconds. The stimulus for each eye is an illuminated white square, subtending an angle of 15° across its width, in the center of which lies a small (,0.05°), dim (,1 millilux), green LED, at optical infinity, that serves as a fixation target. Prior to any pupillometric data being acquired, the subject was asked to place his or her face on the face rest that excludes ambient illumination and to view the fixation target. Retinal sensitivity threshold falls rapidly during these 30 seconds of dark adaptation period (11). Following it, an acquisition period of 28 seconds was initiated. Seven hun-dred frames were captured at a rate of 25 frames per second. Stimulus pulses were ON for 0.4 seconds and OFF for 1.6 seconds and alternated between left eye and right eye. A "stimulus pair" is one such set of stimuli (Fig. 1). The stimulus sequence was repeated 7 times during the acquisi-tion, resulting in 7 stimulus pairs. After the acquisition was complete, the subject was allowed to move his or her head away from the instrument for a few seconds before reposi-tioning and starting the dark adaptation period for the next acquisition. This aims to produce a uniform state of dark adaptation prior to each acquisition. Two acquisitions were carried out at each of 0.04, 0.4, and 4 lux for every patient. Images of the pupil during the test were continuously captured and analyzed by the proprietary software to determine the horizontal pupil diameter. The software allows removal of unwanted artifacts from the trace, e.g., blinks or poorly fitting pupil traces. The amplitude of pupillary constriction was used for pRAPD calculation (Fig. 1). A mathematical correction for anisocoria was made by esti-mating the equivalent NDF that would be required in the eye with the larger pupil to equalize retinal illumination. The corrected amplitudes were used to calculate the pRAPD using the Procyon algorithm, developed prior to this study, and other alternative methods adopted from the public domain. Calibration of the pRAPD Algorithm RAPD assessment instruments need to be able to differen-tiate not only between diseased and nondiseased subjects but also between subtle stages of disease progression. Therefore, FIG. 1. A stimulus pair showing pupillary constriction amplitudes of left eye and right eye stimulations. 112 Shwe-Tin et al: J Neuro-Ophthalmol 2012; 32: 111-115 Original Contribution Copyright © North American Neuro-Ophthalmology Society. Unauthorized reproduction of this article is prohibited. we measured the subjects' pRAPD in the absence of any filter (0 log units) and then in the presence of each 1 of 3 known filters: 0.3, 0.6, and 0.9 log units (Kodak No. 96 "Wratten" NDFs, Procyon Instruments Ltd., England), placed in one of the stimulus pathways, mimicking increasing disease severity. The right eye or left eye was chosen arbi-trarily by the examiner each day. In order to achieve a common calibration factor for all pRAPD results obtained, the lateralized and signed data were changed to absolute values, and a linear regression calibration was derived from the pRAPD plotted against the filter values at which it was recorded. The regression coefficient and intercept described the absolute scaling bias of the pRAPD measurement across all filters. Application of the regression equation to each "raw" value allowed us to center each filter population close to known filter value, in a pattern of best fit for all filters. The calibrated pRAPD values without a filter in place were used to estimate the ranges of baseline line, or physiological, pRAPDs for our cohort of healthy volunteers. Test of Diagnostic Accuracy The data were tested for normal distribution before any parametric testing was instituted. The receiver operator characteristic (ROC) curves were constructed for subgroup comparison using the results of no filter cf. 0.3, 0.3 cf. 0.6, and 0.6 cf. 0.9 log unit filters. This was done for both the proprietary algorithm and the alternative methods (see Appendix E1, Supplemental Digital Content 1, http://links.lww.com/WNO/A31). RESULTS Fifty healthy subjects (17 males and 33 females) were included in the study. The mean age (±standard deviation) of the subjects was 45 years (±15 years, range, 16-78 years). Our uncalibrated results show that the frequency distribution of physiological pRAPD estimates was similar to that previously reported in the literature (6): 40% cf. 52% (pRAPD , 0.08), 48% cf. 42% (0.08 , pRAPD , 0.22), and 10% cf. 6% (0.22 , pRAPD , 0.39). After the results were calibrated, 90% of our cohort had pRAPD of less than 0.08 log units (Table 1). Figure 2 shows the regression line through the pRAPDs with each filter for each subject. The mean and dispersion of the raw pRAPDs from the pupillometer were larger than expected with increasing filter values. The calibration factors obtained, m = 1.5439 and c = 0.1178, were used to convert the raw RAPD measurements into calibrated RAPD measurements. Some overlap between the distributions of response to the NDFs was noted. In order to assess the probability that a given RAPD score belongs to a particular filter response population, the z-score probability was calculated. Left-handed z-score gives the proportion of subjects from a normal population that lie below a given point, and the right-handed z-score gives the proportion above the point. If the given pRAPD value is below the mean of the filter group, then the left-hand probability is used. If it is above, the right-hand probability is used. In order to standardize the z-score probability as a proportion of 100, the calculated z-score probability with a particular filter was divided by the sum of the z-score probabilities for all filters tested. The standardized z-scores are shown (see Table E1, Supplemental Digital Content 2, http://links.lww.com/WNO/A32). By expressing the results in this way, the clinician can assess the probability of any pRAPD belonging to a population centered on each filter value (Fig. 3). Results from normality testing indicated that the pRAPDs after calibration were not normally distrib-uted. We therefore employed a Box-Cox transformation (y = [(x + 2)−2 − 1]/−2) to render the data normally distributed for all filter populations to assess the z-score. ROC curves were derived for detecting a unilateral simulated RAPD of 0.3 log units, and unilateral disease TABLE 1. The distribution of baseline pRAPD before and after calibration compared with the previous report of normal subjects (6) pRAPD (Log Units) pRAPDraw Procyon pRAPDcalibrated Procyon pRAPD (6) RAPD , 0.08, n (%) 20 (40) 45 (90) 53 (52) 0.08 # RAPD , 0.22, n (%) 24 (48) 4 (8) 43 (42) 0.22 # RAPD , 0.39, n (%) 5 (10) 1 (2) 6 (6) RAPD $ 0.39, n (%) 1 (2) 0 (0) 0 (0) Total, N (%) 50 (100) 50 (100) 102 (100) FIG. 2. Plot of the raw pRAPD at each neutral density value allows fitting of a regression line (m = 1.5439 and c = 0.1178 that we used to calibrate the output). Shwe-Tin et al: J Neuro-Ophthalmol 2012; 32: 111-115 113 Original Contribution Copyright © North American Neuro-Ophthalmology Society. Unauthorized reproduction of this article is prohibited. progression simulated with steps of 0.3 log units induced by the NDFs for all methods. The uncalibrated raw data were used for the proprietary algorithm. The area under the ROC curves (AUC) is summarized in Table 2. For all methods, the optimum discrimination was noted for detect-ing a unilateral simulated pRAPD of 0.3 log units. The AUCs for the proprietary algorithm were higher than any of the alternative methods evaluated at any light level. For the proprietary method, the AUC for detecting a unilateral simulated pRAPD of 0.3 log units and progressions of uni-lateral simulated pRAPD from 0.3 to 0.6 and 0.6-0.9 log units was 0.99 (95% confidence interval [CI], 0.95-1.00), 0.86 (95% CI, 0.78-0.92), and 0.79 (95% CI, 0.70-0.87), respectively. The sensitivity and specificity for detecting a unilateral simulated disease of 0.3 log units was 98% (95% CI, 88%-99%) (Fig. 4). DISCUSSION An RAPD is present when there is an asymmetry between afferent conductions to the pupillomotor cen-ters in the brainstem. A small amount of "physiological" RAPD is expected in healthy individuals (6). An RAPD may also be seen in unilateral disease conditions or bilateral asymmetric conditions. These 3 states need to be distinguished. Wilhelm et al (6) discussed in detail the distribution of 102 normal subjects' pRAPDs. Our findings show a similar frequency distribution (Table 1), and calibration resulted in a tighter CI of the ranges of physiological RAPD. In reviewing the studies (4,6) that have described the limits of pRAPD variation within normal population, an isolated pRAPD in the range of 0.3 log units that is not associated with any other clinical or historical findings is considered to be physiological, although there were some TABLE 2. The AUC with the 95% CIs for alternative algorithms (M1, M2, and M3) compared with the proprietary method for distinguishing between adjacent NDF groups AUC (Asymptotic 95% CI) Proprietary M1 M2 M3 0.0 cf. 0.3 NDF (simulated unilateral disease) 4 lux 0.99 (0.97-1.00) 0.90 (0.84-0.96) 0.91 (0.85-0.96) 0.93 (0.89-0.98) 0.4 lux 0.91 (0.85-0.97) 0.91 (0.85-0.96) 0.92 (0.87-0.98) 0.04 lux 0.95 (0.90-0.99) 0.95 (0.90-0.99) 0.97 (0.95-1.00) 0.3 cf. 0.6 NDF (simulated unilateral disease progression) 4 lux 0.86 (0.79-0.93) 0.83 (0.75-0.91) 0.83 (0.75-0.91) 0.68 (0.57-0.78) 0.4 lux 0.73 (0.63-0.83) 0.72 (0.62-0.82) 0.66 (0.55-0.76) 0.04 lux 0.78 (0.69-0.87) 0.78 (0.69-0.88) 0.66 (0.55-0.77) 0.6 cf. 0.9 NDF (simulated unilateral disease progression) 4 lux 0.79 (0.70-0.88) 0.65 (0.54-0.76) 0.65 (0.54-0.75) 0.58 (0.47-0.69) 0.4 lux 0.71 (0.60-0.81) 0.69 (0.59-0.80) 0.61 (0.50-0.72) 0.04 lux 0.64 (0.53-0.74) 0.63 (0.52-0.74) 0.58 (0.47-0.70) FIG. 3. The standardized probability that the measured pRAPD comes from each of the 4 filter groups. FIG. 4. ROC curves comparing the Procyon proprietary algorithm with alternative algorithms (M1, M2, and M3) for distinguishing between 0 and 0.3 log unit filters (M1, M2, and M3 at 4.0 lux). 114 Shwe-Tin et al: J Neuro-Ophthalmol 2012; 32: 111-115 Original Contribution Copyright © North American Neuro-Ophthalmology Society. Unauthorized reproduction of this article is prohibited. exceptional cases or outliers where the normal pRAPD was found to be between 0.3 and 0.4 log units (4,6). None of these studies further categorize RAPD severity. We postu-late that it will be useful to have an assessment of the likeli-hood of any given measurement being "just beyond normality" (0.3 log unit group), "mildly beyond normality" (0.6 log unit group), and "considerably beyond normality" (0.9 log unit group) (Fig. 3). To optimize the pupillometer's diagnostic accuracy, we recorded the pupillometer's RAPD estimates for NDFs of known optical density. We have minimized the variability of intersubject testing by dark adapting each subject for 30 seconds prior to each test and performing all tests in the same room with the same testing environment. We have also investigated how the alternative pRAPD calculation algorithms in the public domain compare with the proprietary algorithm. The metrics derived from the Procyon pupillograms were used to calculate the pRAPD using 3 different methods (see Appendix E1, Supplemental Digital Content 1, http://links.lww.com/WNO/A31). The choice of light stimulus is one of many parameters that determines outcome performance. We have shown the results for each light stimulus intensity used (Table 2). The Procyon algorithm uses all of the light stimulus intensities tested. Although calibration has no bearing on the sensitivity and specificity in the detection of disease process, we deliberately used uncalibrated data for the proprietary algorithm for this part of the study because the calibration factor had been derived from the same sample. Using the Procyon pupillom-eter, all methods of defining pRAPD tested had acceptable AUCs for distinguishing between 0 and 0.3 log unit NDF. The sensitivity and specificity of Procyon pupillometer using its own algorithm was 98% (binomial 95% CI, 88%-99%). The corresponding AUC was 0.99 (95% CI, 0.95-1.00). Because the limits of physiological RAPD lie in the region of 0-0.3 log units, a highly sensitive and specific test at this level of filter offers clear indication of clinical application. For all methods, the AUCs for detecting disease pro-gression decreased with increasing filter values (Table 2). This may be due to an associated larger intersubject variability of RAPDs produced by larger filter values seen (Fig. 2). We do not know whether this variability is due to intrinsically larger within-subject variability (heteroscedasticity of biodata) for a larger pRAPD or due to a confounder such as fatigue that the subject may experience on receiving repeated tests with increas-ing filter densities or both. According to our results, the proprietary algorithm outperforms other algorithms for all groups of filter densities. One difference is that the proprietary algorithm incorporates all available pupil light responses, whereas the alternative algorithms use a single light stimulus. This may be advantageous because the choice of light stimulus is one of the multiple parameters that collectively deter-mines outcome performance. Yet it remains to be seen if the other pupillometers using the Procyon's proprietary al-gorithm produce superior results to others reported in the literature (4-9). REFERENCES 1. Miller NR. Disorders of pupillary function, accommodation, and lacrimation: neurologic abnormalities that affect pupillary size and reactivity. In: Miller NR, ed. Walsh and Hoyt's Clinical Neuro-ophthalmology. Vol 2. 4th edition. Baltimore, MD: Williams & Wilkins, 1985:476-479. 2. Levatin P. Pupillary escape in disease of the retina or optic nerve. Arch Ophthalmol. 1959;62:768-779. 3. Thompson HS, Corbett JJ, Cox TA. How to measure the relative afferent pupillary defect. Surv Ophthalmol. 1981;26:39-42. 4. Kawasaki A, Moore P, Kardon RH. Variability of the relative afferent pupillary defect. Am J Ophthalmol. 1995;120:622-633. 5. Loewenfeld IE, Newsome DA. Iris mechanics I. Influence of pupil size on dynamics of pupillary movements. Am J Ophthalmol. 1971;71:347-362. 6. Wilhelm H, Peters T, Lüdtke H, Wilhelm B. The prevalence of relative afferent pupillary defects in normal subjects. J Neuroophthalmol. 2007;27:263-267. 7. Kalaboukhova L, Fridhammar V, Lindblom B. An objective method for measuring relative afferent pupillary defect in glaucomatous optic neuropathy-stimulus optimization. Neuroophthalmology. 2006;30:7-15. 8. Lankaranian D, Altangerel U, Spaeth GL, Leavitt JA, Steinmann WC. The usefulness of a new method of testing for a relative afferent pupillary defect in patients with ocular hypertension and glaucoma. Trans Am Ophthalmol Soc. 2005;103:200-207; discussion 207-208. 9. Volpe NJ, Plotkin ES, Maguire MG, Hariprasad R, Galetta SL. Portable pupillography of the swinging flashlight test to detect afferent pupillary defects. Ophthalmology. 2000;107:1913-1921; discussion 1922. 10. Thompson HS. The pupil. In: Craven L, Rudolph P, eds. Adler's Physiology of the Eye, 9th edition. St Louis, MO: George S. Stamathis, 1992:412-440. 11. Hart WM. Visual adaptation. In: Craven L, Rudolph P, eds. Adler's Physiology of the Eye, 9th edition. St Louis, MO: George S. Stamathis, 1992:502-530. Shwe-Tin et al: J Neuro-Ophthalmol 2012; 32: 111-115 115 Original Contribution Copyright © North American Neuro-Ophthalmology Society. Unauthorized reproduction of this article is prohibited. |