| OCR Text |
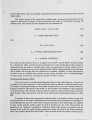
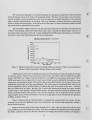
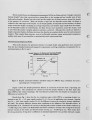
Show DROPLET GASIFICATION BEHAVIOR ..e2.5~~---------------, M I g )( 110.0 N E ..5 37.6 "0 ! CD 5- 26.0 <I) 12.6 x. ---Pure TECA ................ Pure Nonane - . - Blended, Le-l 0.0 +----..----r----r---..----r-----I 0.0 20.0 40.0 eo.o 80.0 100.0 120.0 Time (milliseconds) Figure 4. Droplet diameter squared as a function of time for pure and blended droplets. used for vaporization), the surface area decreases linearly with time. This theory is known as the D2_Law10 , and experiments have exhibited this linear behaviour for a wide variety of fuels, under a wide variety of conditions. From Fig. 4, we see that the pure nonane droplet follows the D2-Law, although detailed results show that the reaction zone is on the order of five radii thick. At first glance, data in Figure 4 would seem to indicate that the pure TECA droplet and the blended droplet also follow linear D2 behavior (constant slope of D2 vs. time). However, detailed results show that the gasification rates of the pure TECA and the blended droplets are not constant. The gasification rate of the blended droplet is constant for a short time while the nonane burns, but then gradually decreases until at 100 msec, the gasification rate is almost the same as the pure TECA droplet (seen as parallel lines in Figure 4) . The gasification rate of the pure TECA droplet increases with time throughout the droplet life. Predicted droplet gasification rates, calculated from Fig. 4 at nominally 40 milliseconds were compared with experimental data from Ref. 4. The one-dimensional multicomponent model predicts burning rates conservatively low, apparently due to the absence of convection in the model. (The experimental data are for Reynolds numbers on the order of two.) The model predicts a burning rate of 0.73 mm2/sec for pure noname, compared to 0.93 mm2/ sec measured by experiments. For the blended droplet, the model predicts 0.52 compared to 0.90 mm2/sec measured by experiments. For a pure TECA droplet, the model shows the gasification is non-linear, with the burning rate increasing from 0.2 and 0.4 mm2/sec, compared to a constant 0.55 mm2/sec measured by experiment. Although the quantitative agreement between experiments and predictions is not exact, the relative trends are mirrored. Both experimental data and numerical predictions show a definite increase in gasification rates upon blending. Experimental data show that blending improves the burning rate of TECA by 65% over pure TECA. The model shows a similar improvement in burning rate, however an exact comparison is not possible due to the non-linear gasification of pure TECA. For pure nonane, the numerical prediction is within 20% of experimental data. Considering the simple chemical kinetics, and the lack of convection in the model, this is reasonable agreement. In a later section we will show the effect of a 20% change in burning rate on droplet trajectory. Calculations based on data from Fig. 4 and known concentration profiles inside the droplet show that after 120 msec only 5% of the original TECA mass remains in the blended droplet, whereas 18% remains in the pure TECA droplet. Therefore, we see that blending small amounts of hydrocarbon fuel is an effective way to aid destruction of hazardous wastes such as TECA. 7 |