| OCR Text |
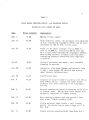
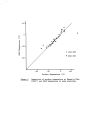
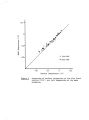
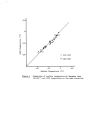
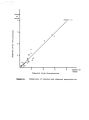
Show 6 in the scatter diagram of Fig. 5 in which the computed precipitation total ( horizontal axis) is plotted against the observed precipitation ( vertical axis). It is seen that the computed value agrees quite satisfactorily with the observed for most cases-- especial1y when the inherent errors of the data are considered ( such as large time intervals between sounding and map data, and inaccuracies in the observed snow depth due to drifting). Other errors in excess of 0.25 in. can be related to non- orographic effects such as heavy snowfall associated with active frontal systems, and heavier than computed precipitation associated with very unstable conditions and pronounced dynamically induced upward motion due to synoptic conditions. These situations are usually associated with sub- stantial precipitation amounts at the Salt Lake City Airport where precipitation depends more upon dynamic lifting and not mechanical lifting. On the other hand, cases where precipitation was less than that computed can usually be identified with the situation where there is sufficient moisture and orographic lift, but synoptic conditions ( such as anti-cyclonic curvature, wind shear, vorticity, etc.;) tend to inhibit the orographic effect by subsidence. This is sometimes the case with overrunning moisture from the Pacific which is advancing over the western United States which is dominated by an upper air ridge. An analysis of errors greater than 0.25 in. In shown in Table 2. USE IN PREDICTION Numerical weather analysis has made possible fairly accurate prediction of the upper air features, surface conditions and winds aloft for |