| Title |
Pilot-Scale Testing of Nonsteady Boiler Waste Cofiring |
| Creator |
Mason, H. B.; Nicholson, J. A.; DeRosier, R. J.; Wolbach, C. D.; Licis, I. J. |
| Publisher |
University of Utah |
| Date |
1987 |
| Spatial Coverage |
presented at Palm Springs, California |
| Abstract |
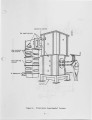
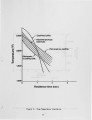
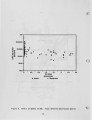
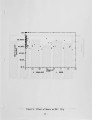
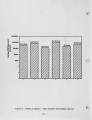
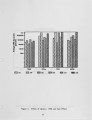
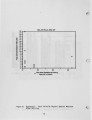
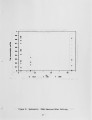
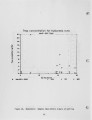
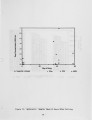
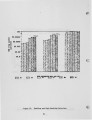
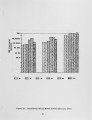
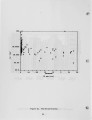
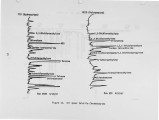
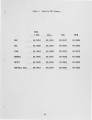
Waste thermal destruction characteristics were measured for the cofiring of conventional fuels and chlorinated organics in a 2 million Btu/hr boiler simulator operated under transient and off-design conditions. These nonsteady tests were run to extend and interpret the boiler cofiring data base from 14 prior industrial boiler field tests. The pilot facility had four wall-fired burners to simulate a large wall-fired industrial boiler. Three burners were fired on gas, oil, or coal while the fourth burner was fired on a simulated waste mixture of distillate oil, carbon tetrachloride, trichlorethylene, monoch10robenzene, and trich10robenzene. Nonsteady and offdesign operating modes tested included low excess air firing, atomization upsets, transient firebox temperatures, and variable firing rate, residence time, and waste or fuel flowrates. During these upset runs, extractive flue gas samples were taken with the volatile organic sampling train (VOST) and the Modified Method 5 (MM5) train to quantify volatile and semi volatile organics. Waste destruction results showed uniformly high destruction efficiencies even under major upset conditions where combustion conditions were poor. The test average destruction and removal efficiency (ORE) was 99.9993 percent for volatile compounds and 99.9997 for semivolatiles compared to the field test average of 99.998 percent. No major consistent differences in destruction characteristics were observed among the three fuels and the three volatile compounds tested. Waste destruction was generally less efficient under upset conditions compared to normal operation. Products of incomplete combustion (PICs) were emitted at average levels about seven times the emissions of principle organic hazardous constituents (POHCs). The analytical procedures accounted for about 90 percent of chlorinated volatile PICs and about 80 percent of nonchlorinated hydrocarbons. Residual emissions of POHCs and PICs were observed after waste firing was curtailed. The hysteresis emission levels immediately after waste firing were of the same order as emissions during normal operation; they were generally lower than emissions during upsets. The severity of the hysteresis generally increased as the boiler heat transfer surfaces became increasingly loaded with soot and ash deposits, implying that some organics may be absorbed temporarily on boiler deposits. The role of soot deposits was also suggested by sootblowing tests where emissions were higher than normal when deposits were being removed, and the severity of hysteresis was reduced after sootblowing. |
| Type |
Text |
| Format |
application/pdf |
| Language |
eng |
| Rights |
This material may be protected by copyright. Permission required for use in any form. For further information please contact the American Flame Research Committee. |
| Conversion Specifications |
Original scanned with Canon EOS-1Ds Mark II, 16.7 megapixel digital camera and saved as 400 ppi uncompressed TIFF, 16 bit depth. |
| Scanning Technician |
Cliodhna Davis |
| ARK |
ark:/87278/s6nk3hk7 |
| Setname |
uu_afrc |
| ID |
4162 |
| Reference URL |
https://collections.lib.utah.edu/ark:/87278/s6nk3hk7 |