| Title |
In-Situ Size Measurements in an Industrial Boiler |
| Creator |
Annen, K.; Goodwin, W.; Stewart, G.; Nelms, C. |
| Publisher |
University of Utah |
| Date |
1983 |
| Spatial Coverage |
Akron, Ohio |
| Abstract |
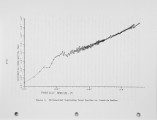
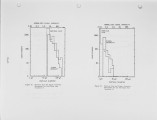
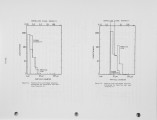
A laser backscatter particle size measurement technique was used in the in-situ measurement of single particles in an industrial boiler. This technique was selected because of its ability to meet the physical requirements of the application and because of its simplicity. The backscatter configuration allows all of the optical components to be mounted on a single optical breadboard of reasonable size. This minimizes problems caused by vibration and thermal expansion and also allows the measurement system to be moved from location to location with only fine adjustments needed to ensure proper alignment. Measurements were made at four locations within the boiler for a number of run conditions at each location. Measurement locations were from 6.5 ft. to 10 ft. inside the boiler. Results in the form of signal strength and particle size histograms were obtained for each run condition. Histogram size bins extended from 1 um to 140 um in particle diameter. The accuracy and size resolution of the measurements are discussed. The laser backscatter technique for particle measurement is well suited for applications in which in-situ measurements of moderate accuracy are desired for gas streams having a particle concentration on the order of 10^3 to 10^4 cm^-3 or less. The measurements give very high spatial resolution and are capable of handling a dynamic range in particle size of greater than 100. Measurement locations which lie as far as ~25 ft. inside a boiler are possible for this system. |
| Type |
Text |
| Format |
application/pdf |
| Language |
eng |
| Rights |
This material may be protected by copyright. Permission required for use in any form. For further information please contact the American Flame Research Committee. |
| Conversion Specifications |
Original scanned with Canon EOS-1Ds Mark II, 16.7 megapixel digital camera and saved as 400 ppi uncompressed TIFF, 16 bit depth. |
| Scanning Technician |
Cliodhna Davis |
| ARK |
ark:/87278/s6kh0qvv |
| Setname |
uu_afrc |
| ID |
676 |
| Reference URL |
https://collections.lib.utah.edu/ark:/87278/s6kh0qvv |


