| Title |
Robust Optimal Control of a Natural Gas-Fired Burner for the Control of Oxides of Nitrogen (NOx) |
| Creator |
St. John, David; Samuelsen, Scott |
| Publisher |
University of Utah |
| Date |
1995 |
| Spatial Coverage |
presented at Monterey, California |
| Abstract |
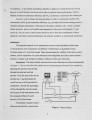
Tightening requirements on industrial boilers and furnaces will require hands-free techniques to (1) assure peak performance with respect to emission, and (2) assure an ability to achieve peak performance throughout a load duty cycle. In the present paper, robust optimal control of a model industrial, swirl-stabilized, natural gas-fired burner is explored as a strategy to attain and maintain low flue-gas nitrogen oxide concentration ([N0xD concomitant with high combustion efficiency (nc). A performance index, J, is defined such that the maximization of J correlates to optimal burner performance, with respect to [NOx] and llc. Two parameters, swirl intensity (S') and excess air (EA), are made amenable to control and incorporated as variable burner inputs. The two measurable burner outputs, [NOx] and nc are continuously monitored. For a given load, the settings of EA and S' are automatically adjusted by a specialized search algorithm in order to maximize the performance index, thereby optimizing nc and [NOx]. The robustness of the approach is demonstrated and evaluated by initiating a change in load and observing the reaction of the modified control system. The control scheme is shown to effectively increase and maintain overall burner performance. Implementation of robust optimal control to practical systems is discussed in terms of challenges outstanding and opportunities to integrate with overall system performance. |
| Type |
Text |
| Format |
application/pdf |
| Language |
eng |
| Rights |
This material may be protected by copyright. Permission required for use in any form. For further information please contact the American Flame Research Committee. |
| Conversion Specifications |
Original scanned with Canon EOS-1Ds Mark II, 16.7 megapixel digital camera and saved as 400 ppi uncompressed TIFF, 16 bit depth. |
| Scanning Technician |
Cliodhna Davis |
| ARK |
ark:/87278/s6bz68mx |
| Setname |
uu_afrc |
| ID |
8319 |
| Reference URL |
https://collections.lib.utah.edu/ark:/87278/s6bz68mx |