| Title |
Refinery Heater Simulation by the Hottel Zoning Method |
| Creator |
Loftus, Jordan ScD |
| Publisher |
University of Utah |
| Date |
1989 |
| Spatial Coverage |
presented at Short Hills, New Jersey |
| Abstract |
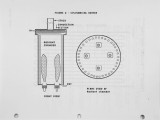
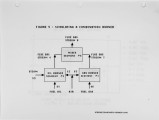
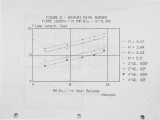
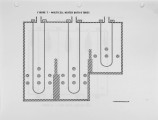
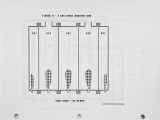
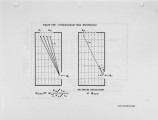
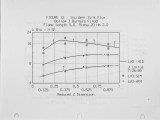
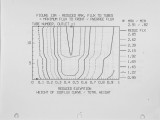
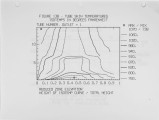
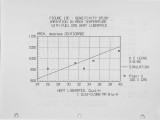
The Heater Design System (HDS) is a comprehensive set of Fortran VS77 routines which simulates the behavior of refinery heaters. It is a heat transfer, mass and energy balance program featuring the Similarity of Jet Theory for flow field generation and Hottel Zoning for energy balance solution. The program is used to trouble-shoot plant problems, evaluate competing vendor designs and to revamp old heaters for new services. The data required to drive the program are readily accessible to the practicing engineer in a refinery or in an engineering department. On an IBH 3090 Hodel 600 mainframe under HVS/XA/TSO operating system, a cylindrical heater operating with a convection section is simulated in 10.3 CPU seconds when matching process duty and a box heater, 35.6 seconds at specified firing rate. The fuel is either gas, liquid and/or solid; oxidant is air, enriched air or gas turbine exhaust; diluent is a non-oxidant gas mixture, water or steam. The burner may be single or combination fuel fired. The user characterizes the burner by its minimum throat area, air jet angle, pressure drop coefficient and flame length. The flue gas is computed assuming complete combustion. User may specify either excess air, oxygen content or mass rates." The flue gas is simulated by either a 1 clear - 2 grey gas (gas firing) or 3 grey gas model (fuel oil firing). Process side linkage is provided by specifying its temperature and transport properties profile. The inside film heat transfer coefficient is based on equations provided by APIRP530. The program divides an axi-symmetrical cylindrical furnace into 5 by 10 gas volumes, and a box heater into 3 by 4 by 4 rectilinear gas volumes per gas-space. The user specifies the box dimensions, tube layout and burner(s) location. A maximum of 3 gas spaces with different heat transfer requirements is handled. The process coils are replaced by equivalent sink planes. The 3D box heater interchange areas are computed by the method of Hottel and Cohen. Errku data are used for 2D cylindrical heater. |
| Type |
Text |
| Format |
application/pdf |
| Language |
eng |
| Rights |
This material may be protected by copyright. Permission required for use in any form. For further information please contact the American Flame Research Committee. |
| Conversion Specifications |
Original scanned with Canon EOS-1Ds Mark II, 16.7 megapixel digital camera and saved as 400 ppi uncompressed TIFF, 16 bit depth. |
| Scanning Technician |
Cliodhna Davis |
| ARK |
ark:/87278/s6571fkv |
| Setname |
uu_afrc |
| ID |
5479 |
| Reference URL |
https://collections.lib.utah.edu/ark:/87278/s6571fkv |


