| OCR Text |
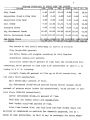
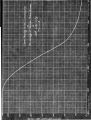
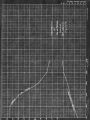
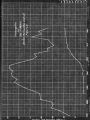
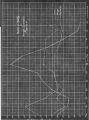
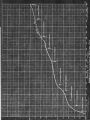
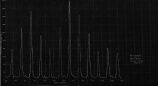
Show When gage readings are taken regularly and frequently for any length of time and the corresponding discharges secured from the rating curve a history of the flow may be plotted as in Fig% 7 . TMs curve is known as a hydrograph. This hydrograph shown is of the Weber Hiver, The readings taken at Oakley Utah, located four miles from the point of diversion. The curve covers a period of twelve years showing the variation of flow from October, 1914 to October 1926 inclusive. It is obvious that the maximum flow occurs during the month of June, while the minimum flow is during the winter months of December, January and February. During June 1921 there was the greatest of low-; m of water from the Weber Hiver- than at any © fcher time through the period of October 1914 to October 1926. From the data and material herein set forth, there is " but one outstanding conclusion and that is that the daily average per capita consumption is nearly twice as great as it should be, and that all cities Salt lake City included, which are now in distress from danger of a water famine and shortage during the summer months, and are consequently in search of additional supplies, can by applying proper methods of conser- r- vation to their present supplies more quickly and cheaply relieve themselves from their distresses. These- conservations being 100 per cent metered, services, careful and diligent supervision and inspection of the pipe systems as to " breaks and leak's. Also be watchful so as to avoid unnecessary wastes that result from excessive running of water in the winter months, trying to prevent freezing of the pipes in the residences and careful regulation as to use of water for irrigation of family garde;^&;.\ l? iy'' foilowing the above methods every growing city will have an'. abundant and adequate supply of water fcr twice as many inhabitants':,' as thiay1. iicw\'< ha ve. PI1TIS |