| Title |
Initial Test Results for a New Class of Regenerative Radiant Burners |
| Creator |
Bjerklie, John W.; Zwick, Eugene B.; Panahi, Sherry K.; Watkins, Larry |
| Publisher |
University of Utah |
| Date |
1992 |
| Spatial Coverage |
presented at Cambridge, Massachusetts |
| Abstract |
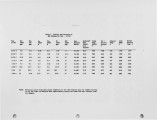
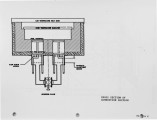
The RRB concept and its potential advantages are described, the results of the development effort are shown and the significance of a completely developed RRB operating according to the sponsors' specifications is discussed. Tests showed that the NOx levels of this new class of high temperature, high efficiency, industrial regenerative radiant burner scan be held much lower than 10 ppm, referred to 3% oxygen in the exhaust, at surface temperatures in the 2400 to 2600 F range and load temperatures in the 1700 to 1850 F range, with combustion air preheated to 1600 to 1700 F. |
| Type |
Text |
| Format |
application/pdf |
| Language |
eng |
| Rights |
This material may be protected by copyright. Permission required for use in any form. For further information please contact the American Flame Research Committee. |
| Conversion Specifications |
Original scanned with Canon EOS-1Ds Mark II, 16.7 megapixel digital camera and saved as 400 ppi uncompressed TIFF, 16 bit depth. |
| Scanning Technician |
Cliodhna Davis |
| ARK |
ark:/87278/s64t6mz9 |
| Setname |
uu_afrc |
| ID |
10203 |
| Reference URL |
https://collections.lib.utah.edu/ark:/87278/s64t6mz9 |


