| Title |
Pilot Evaluation of Reburning for Cyclone Boiler NOx Control |
| Creator |
Farzan, H.; Rodgers, L.; Maringo, G.; Kokkinos, A.; Pratapas, J. |
| Publisher |
University of Utah |
| Date |
1988 |
| Spatial Coverage |
presented at Pittsburgh, Pennsylvania |
| Abstract |
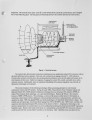
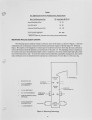
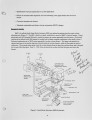
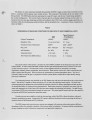
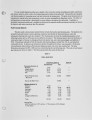
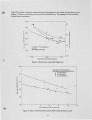
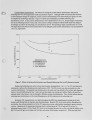
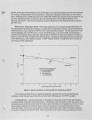
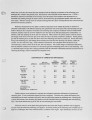
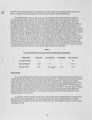
There are currently no commercially-demonstrated combustion modification techniques for cyclone boilers which reduce NOx emissions. The emerging reburning technology offers cyclone boiler owners a promising alternative to expensive flue gas cleanup techniques for NOx emission reduction. Reburning involves the injection of a supplemental fuel (natural gas, oil, or coal) into the main furnace in order to produce locally reducing stoichiometric conditions which convert NOx produced in the main combustion zone to molecular nitrogen, thereby reducing overall NOx emissions. This paper presents the encouraging pilot-scale results obtained using natural gas, fuel oil, and pulverized coal (PC) as reburning fuels. At a reburning zone stoichiometry of 0.9,67% NOx reduction for gas and oil reburning and 57% for coal reburning were achieved. Flue gas recirculation (FGR) was introduced at the reburning burners, and improved mixing and NOx reduction. FGR was more effective with PC reburning. Carbon monoxide (CO) emissions levels were low (less than 30 ppm) throughout the various optimum test conditions. Although the carbon content of the fly ash increased, the overall combustion efficiencies were insignificantly lower for all the reburning fuels. Furnace exit gas temperatures increased by less than 500F during reburning operation. The impact of reburning technology to full-scale cyclone boiler operation is currently under investigation. |
| Type |
Text |
| Format |
application/pdf |
| Language |
eng |
| Rights |
This material may be protected by copyright. Permission required for use in any form. For further information please contact the American Flame Research Committee. |
| Conversion Specifications |
Original scanned with Canon EOS-1Ds Mark II, 16.7 megapixel digital camera and saved as 400 ppi uncompressed TIFF, 16 bit depth. |
| Scanning Technician |
Cliodhna Davis |
| ARK |
ark:/87278/s64f1t84 |
| Setname |
uu_afrc |
| ID |
4946 |
| Reference URL |
https://collections.lib.utah.edu/ark:/87278/s64f1t84 |