| Title |
The Effect of Pulverised Coal Type and Burner Parameters When Staging Air Combustion for NOx Reduction |
| Creator |
Phelan, W. J. |
| Publisher |
University of Utah |
| Date |
1983 |
| Spatial Coverage |
Akron, Ohio |
| Abstract |
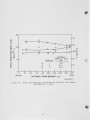
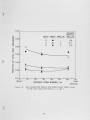
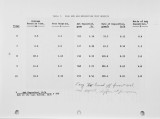
Staged air combustion is known to be an attractive NOx abatement technique. This paper summarises the experimental data generated on the subject of staged combustion of pulverised coal at the IFRF in the last eighteen months. The work centred on the firing of eleven coals, diverse in properties, on an experimental staged mixing burner at a pilot scale of 2.5 MW and the subsequent firing of four of these coals at an experimental scale of 0.18 MW in a specially designed furnace resulting in a controlled environment. The latter combustion trial consisted of fundamental studies on selective staged mixing burner parameters which had been shown at the larger scale to be important to the reduction of NOx. The effect on NOx emissions, for staged and nonstaged flames, of coal type, inputs and hardware features of the staged mixing burner are examined herein. The work described in this paper has been executed on behalf of and financially supported by the Government of the Netherlands, through their Project Office for Energy Research (BEOP) and forms a part of the Netherland's National Coal Research Programme. |
| Type |
Text |
| Format |
application/pdf |
| Language |
eng |
| Rights |
This material may be protected by copyright. Permission required for use in any form. For further information please contact the American Flame Research Committee. |
| Conversion Specifications |
Original scanned with Canon EOS-1Ds Mark II, 16.7 megapixel digital camera and saved as 400 ppi uncompressed TIFF, 16 bit depth. |
| Scanning Technician |
Cliodhna Davis |
| ARK |
ark:/87278/s64f1t7p |
| Setname |
uu_afrc |
| ID |
387 |
| Reference URL |
https://collections.lib.utah.edu/ark:/87278/s64f1t7p |