| OCR Text |
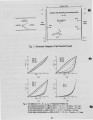
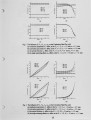
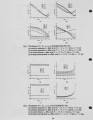
Show The above analyses demonstrate that the parameters having more distinctive effects on the temperature profile in the preheat zone include N" and to, The effects of NI and c!)o are less obvious. The physical significance lies in that under the boundary condition of identical temperatures, an increase in the flow velocity of fuel gas can significantly reduce the thickness of the preheat zone at the flame front. 3.2 The Effects on the Conduction Heat Flux Figure 3(a) indicates that as NI increases (Le. the role of conduction becomes more important), the heat conduction shows an almost equal rate of change with NI . N I ~ 10 the conduction heat flux generally falls between 0 and 10. Nt> 10 the heat conduction scale displays fluctuating changes. The observation of changes of N" from 0.01 to 20(Figure 3(b» reveals that as N" increases, two different tendencies of heat conduction may occur. N" ~ 1.0 the heat conduction curve increases gradually, which indicates that the heat conduction flux on the fuel face is greater than that on the flame face. Besides, as N" increases, the distribution of the heat conduction curve gradually slow down. N '2 > 1.0 the heat conduction curve decreases rapidly while approaching the flame face, which signifies tremendous changes in heat conduction flux. This phenomenon also intensifies as N1. increases. The observation of changes of to from 0.001 to 4.0(Figure 3(c» indicates that the decrease of to has dramatic effects on heat conduction. to ~ 0.1 the conduction heat flux generally falls between -10 and o. to < 0.1 the heat conduction scale shows fluctuating changes. Figure 3(d) indicates limited changes of heat conduction as a result of changes in (1.)0. Besides, the curve flux generally displays dented and gradually decreasing changes. The above analyses show that parameters Nt and to have significant effects on heat conduction, while Nl only changes the flux tendency without significant influence on its order scale. The (1.)0 parameter almost has no effects at all. Overall, these results are consistent with the conduction theories (proportional with molecular heat conduction characteristics, and opposite with heat conduction thickness). 3.3 The Effects on the Convection Heat Flux Figure 4(a) indicates that as Nl increases (i.e. the role of conduction becomes more important), the heat convection changes from a linear relationship to a curve. NI < 1.0 the convection heat flux shows a slightly dented, and gradually increasing curve upward. N I ~ 1.0 the heat convection displays linear changes regardless of the increase in N I value. The observation of changes of N1. from 0.01 to 20(Figure 4(b» reveals that the heat convection increases slightly as N 1. increases. N" < 1.0 the convection heat flux is almost a horlzontalline without any changes. N" ~ 1.0 the convection heat flux increases rapidly while approaching the flame face, which signifies tremendous changes in conduction heat flux. This phenomenon intensifies as N2 increases. 7 |