| OCR Text |
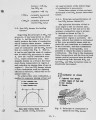
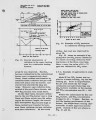
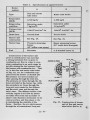
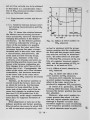
Show « 200 o (A V) a S 150 UJ 1 100 E Q. X O 50 » - • - * ***** - V ^ **** + ^ ~ • ^ ^ * \ * ^ 1 ^-^v aAtiorm ization ^Conventional f burner Steam ~ atomization - Air (itemization 1 • - -e, Steam atomization Model E E low N O x burner I . I 0 100 200 300 400 500 600 Combustion Air Temp (*C) Fig. 11. Effect of combustion air temperature on N O x emission (Straight burner tile) When it comes to Model E E of (c), the distance between two mainstreams becomes wider, and the mixing of fuel and air is suppressed. N O x value decreases lower in this order. However, even with Model EE, if the velocity of the fuel stream is slow as shown by (d), fuel is entrained into the air, and fuel stream vanishes. Then, N O x value also increases at this time. There is a considerable difference in flame temperature distribution between Model E burner and Model EE burner as will be stated hereafter, and these burners can be selected as adjusted with the properties of the heated object. Table 1. N O x attaining value Fuel Butane Coke oven gas Heavy oil C Kerosene NOx (ppm) 3 0 ~ 50 45 ~ 60 45 ~ 60 30 ~ 50 2-3. Flow velocity distribution Mixing characteristics of each burner so far described were investigated with respect to flow velocity distribution of fuel and air. Supposing butane gas as fuel, coinciding momentum and replacing fuel stream with air, it was injected from the burner. Fig. 12 shows flow velocity distribution of the furnace cross section at a position 200 m m away from the burner tile in furnace lengthwise direction. With the conventional burner of (a), fuel stream and air stream are enbloc, but with Model E low NOx burner of (b), they are separated. Fuel 9tream (a) Conventional burner (b) Model E low NOx burner (c) Model EE low NOx burner (d)Modei EE low NOx burner (when velocity of fuel stream is slow) Note : A numeral in the figure Is a relative value when the maximum measured value Is taken to be 100. Fig. 12. Flow velocity distribution 11- 6 - |