Over 70,000 photos covering a variety of topics from Marriott Library Special Collections
TO
| Title | Date | Type | ||
|---|---|---|---|---|
| 1 |
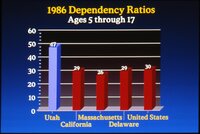 |
1986 dependency ratios | 1986; 1987; 1988 | Image/StillImage |
| 2 |
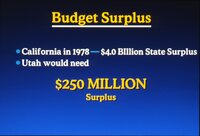 |
Budget surplus | 1986; 1987; 1988 | Image/StillImage |
| 3 |
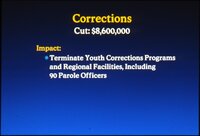 |
Corrections | 1986; 1987; 1988 | Image/StillImage |
| 4 |
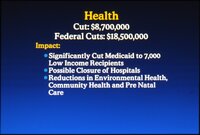 |
Health | 1986; 1987; 1988 | Image/StillImage |
| 5 |
 |
Higher education | 1986; 1987; 1988 | Image/StillImage |
| 6 |
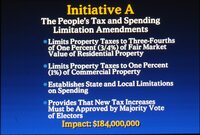 |
Initiative A | 1986; 1987; 1988 | Image/StillImage |
| 7 |
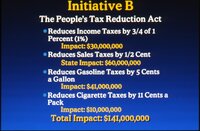 |
Initiative B | 1986; 1987; 1988 | Image/StillImage |
| 8 |
 |
Initiative C | 1986; 1987; 1988 | Image/StillImage |
| 9 |
 |
Other areas | 1986; 1987; 1988 | Image/StillImage |
| 10 |
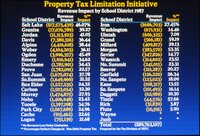 |
Property tax limitation initiative | 1986; 1987; 1988 | Image/StillImage |
| 11 |
 |
Public education | 1986; 1987; 1988 | Image/StillImage |
| 12 |
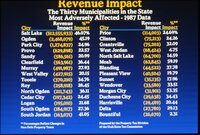 |
Revenue Impact | 1986; 1987; 1988 | Image/StillImage |
| 13 |
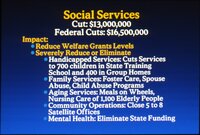 |
Social services | 1986; 1987; 1988 | Image/StillImage |
| 14 |
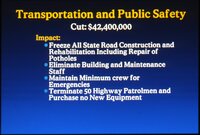 |
Transportation and public safety | 1986; 1987; 1988 | Image/StillImage |
| 15 |
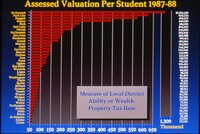 |
Assessed valuation per student | 1986; 1987; 1988 | Image/StillImage |
| 16 |
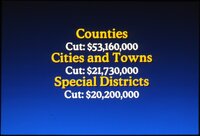 |
Counties, Cities and Towns, Special Districts | 1986; 1987; 1988 | Image/StillImage |
| 17 |
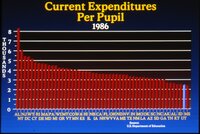 |
Current expenditures per pupil | 1986; 1987; 1988 | Image/StillImage |
| 18 |
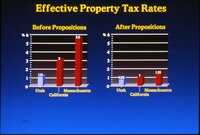 |
Effective property tax rates | 1986; 1987; 1988 | Image/StillImage |
| 19 |
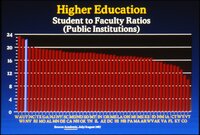 |
Higher education student to faculty ratios | 1986; 1987; 1988 | Image/StillImage |
| 20 |
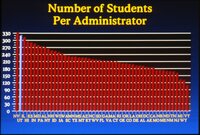 |
Number of students per administrator | 1986; 1987; 1988 | Image/StillImage |
| 21 |
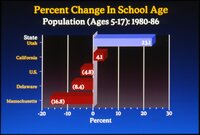 |
Percent change in school age | 1986; 1987; 1988 | Image/StillImage |
| 22 |
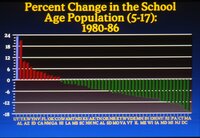 |
Percent change in the school age population | 1986; 1987; 1988 | Image/StillImage |
| 23 |
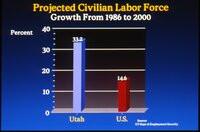 |
Projected civilian labor force | 1986; 1987; 1988 | Image/StillImage |
| 24 |
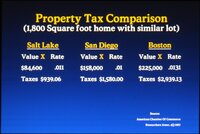 |
Property tax comparison | 1986; 1987; 1988 | Image/StillImage |
| 25 |
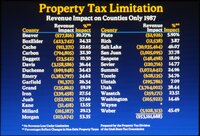 |
Property tax limitation | 1986; 1987; 1988 | Image/StillImage |