Home
Browse
Ask Us
Chat
Harmful Language Statement
Log in
Photo Archives
Advanced Search
About
Over 90,000 photos covering a variety of topics from Marriott Library Special Collections.
Year
1963
1964
1965
1966
1967
1968
1969
1970
1971
1972
1973
1974
1975
1976
1977
1978
1979
1980
1981
1982
1983
1984
1985
1986
1987
1988
TO
1963
1964
1965
1966
1967
1968
1969
1970
1971
1972
1973
1974
1975
1976
1977
1978
1979
1980
1981
1982
1983
1984
1985
1986
1987
1988
Type
Image/StillImage
75
Format
image/jpeg
53
application/pdf
22
Collection
Photo Archives
75
1
-
25
of
75
<
1
2
3
>
Gallery view
Number of results to display per page
10
25
50
100
200
Sort by Relevance
Sort by Title A-Z
Sort by Title Z-A
Sort by Date Ascending
Sort by Date Descending
Sort by Last Modified Ascending
Sort by Last Modified Descending
Title
Date
Type
1
Jupiter Talisman [04]
1977
Image/StillImage
2
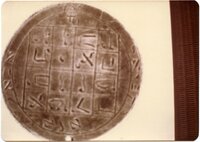
Photograph of round coin-like object with grid of 16 symbols [02]
Image/StillImage
3
Photograph of round coin-like object with grid of 16 symbols [03]
Image/StillImage
4
Photograph of round coin-like object with three symbols [02]
Image/StillImage
5
Photograph of round coin-like object with three symbols [03]
Image/StillImage
6
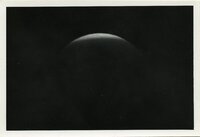
Photograph of the lunar landscape [01]
1965; 1966; 1967; 1968; 1969; 1970; 1971; 1972; 1973; 1974; 1975; 1976; 1977; 1978; 1979; 1980; 1981; 1982; 1983; 1984; 1985
Image/StillImage
7
Photograph of the lunar landscape [02]
1965; 1966; 1967; 1968; 1969; 1970; 1971; 1972; 1973; 1974; 1975; 1976; 1977; 1978; 1979; 1980; 1981; 1982; 1983; 1984; 1985
Image/StillImage
8
Photograph of the lunar landscape [03]
1965; 1966; 1967; 1968; 1969; 1970; 1971; 1972; 1973; 1974; 1975; 1976; 1977; 1978; 1979; 1980; 1981; 1982; 1983; 1984; 1985
Image/StillImage
9
Photograph of the lunar landscape [05]
1965; 1966; 1967; 1968; 1969; 1970; 1971; 1972; 1973; 1974; 1975; 1976; 1977; 1978; 1979; 1980; 1981; 1982; 1983; 1984; 1985
Image/StillImage
10
Photograph of the lunar landscape [06]
1965; 1966; 1967; 1968; 1969; 1970; 1971; 1972; 1973; 1974; 1975; 1976; 1977; 1978; 1979; 1980; 1981; 1982; 1983; 1984; 1985
Image/StillImage
11
Color snapshot of crowd standing around spacecraft in a building
1969
Image/StillImage
12
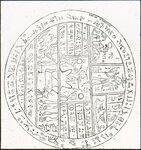
Drawing of round object with many symbols
1988
Image/StillImage
13
Floor plan titled Upper Story of Joseph Smith's Nauvoo Store
1988
Image/StillImage
14
Front of two-story brick building
1988
Image/StillImage
15
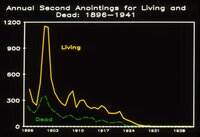
Graph titled Annual Second Annointings for Living and Dead: 1896-1941
1988
Image/StillImage
16
Graph titled Avg. Live Endowments as Percentage of Avg. Net Member Increase 1846-1985
1988
Image/StillImage
17
Graph titled Avg. members vs. Avg. Vicarious Endowments: 1846-1985
1988
Image/StillImage
18
Graph titled Avg. Net Member Increase vs. Avg. Live Endowments 1846-1985
1988
Image/StillImage
19
Graph titled Avg. Vicarious Endowments per Member per Year 1846-1985
1988
Image/StillImage
20
Graph titled Convert Baptisms vs. Live Endowments 1971-1985
1988
Image/StillImage
21
Graph titled Cumulative Totals of Temple Ordinances
1988
Image/StillImage
22
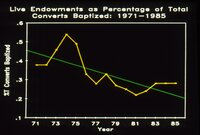
Graph titled Live Endowments as Percentage of Total Converts Baptized 1971-1985
1988
Image/StillImage
23
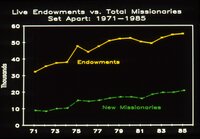
Graph titled Live Endowments vs. Total Missionaries Set Apart 1971-1985
1988
Image/StillImage
24
Graph titled Total Members vs. Vicarious Endowments 1971-1985
1988
Image/StillImage
25
Graph titled Vicarious Endowments per Member per Year 1971-1985
1988
Image/StillImage
1
-
25
of
75
<
1
2
3
>