| Title | Date | Type | Setname | ||
|---|---|---|---|---|---|
| 126 |
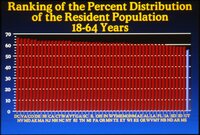 |
Ranking of the percent distribution of the resident population 18-64 years | 1986; 1987; 1988 | Image/StillImage | uum_map |
| 127 |
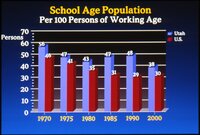 |
School age population per 100 persons of working age 1970-2000 | 1986; 1987; 1988 | Image/StillImage | uum_map |
| 128 |
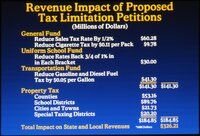 |
Revenue impact of proposed tax limitation petitions | 1986; 1987; 1988 | Image/StillImage | uum_map |
| 129 |
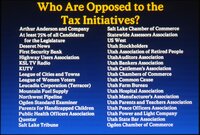 |
Who are opposed to the tax initiatives? | 1986; 1987; 1988 | Image/StillImage | uum_map |
| 130 |
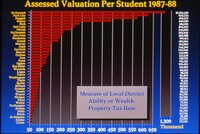 |
Assessed valuation per student | 1986; 1987; 1988 | Image/StillImage | uum_map |
| 131 |
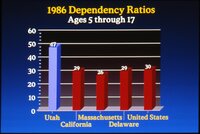 |
1986 dependency ratios | 1986; 1987; 1988 | Image/StillImage | uum_map |
| 132 |
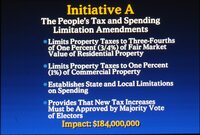 |
Initiative A | 1986; 1987; 1988 | Image/StillImage | uum_map |
| 133 |
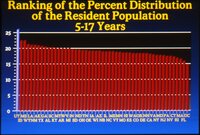 |
Ranking of the percent distribution of the resident population 5-17 years | 1986; 1987; 1988 | Image/StillImage | uum_map |
| 134 |
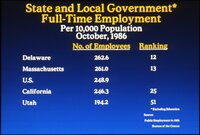 |
State and local government full-time employment | 1986; 1987; 1988 | Image/StillImage | uum_map |
| 135 |
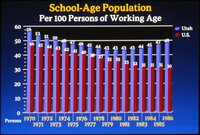 |
School-age population 1970-1986 | 1986; 1987; 1988 | Image/StillImage | uum_map |
| 136 |
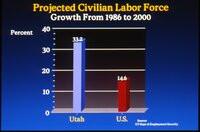 |
Projected civilian labor force | 1986; 1987; 1988 | Image/StillImage | uum_map |
| 137 |
 |
Southern Utah State College | 1986; 1987; 1988 | Image/StillImage | uum_map |
| 138 |
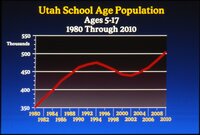 |
Utah school age population | 1986; 1987; 1988 | Image/StillImage | uum_map |
| 139 |
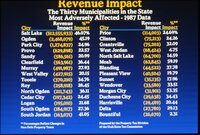 |
Revenue Impact | 1986; 1987; 1988 | Image/StillImage | uum_map |
| 140 |
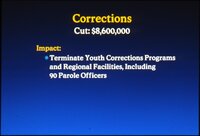 |
Corrections | 1986; 1987; 1988 | Image/StillImage | uum_map |
| 141 |
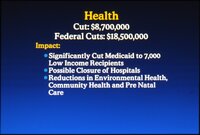 |
Health | 1986; 1987; 1988 | Image/StillImage | uum_map |
| 142 |
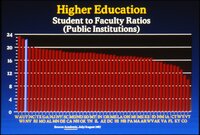 |
Higher education student to faculty ratios | 1986; 1987; 1988 | Image/StillImage | uum_map |
| 143 |
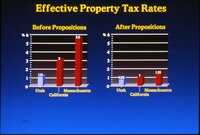 |
Effective property tax rates | 1986; 1987; 1988 | Image/StillImage | uum_map |
| 144 |
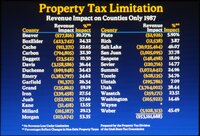 |
Property tax limitation | 1986; 1987; 1988 | Image/StillImage | uum_map |
| 145 |
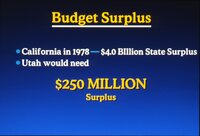 |
Budget surplus | 1986; 1987; 1988 | Image/StillImage | uum_map |
| 146 |
 |
Other areas | 1986; 1987; 1988 | Image/StillImage | uum_map |
| 147 |
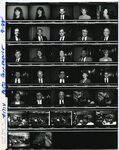 |
Contact sheet of individual and group photos from Taxpayers for Utah press conference | 1988-09 | Image/StillImage | uum_map |
| 148 |
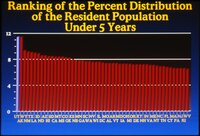 |
Ranking of the percent distribution of the resident population under 5 years | 1986; 1987; 1988 | Image/StillImage | uum_map |
| 149 |
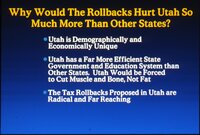 |
Why would the rollbacks hurt Utah so much more than other states? | 1986; 1987; 1988 | Image/StillImage | uum_map |
| 150 |
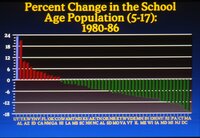 |
Percent change in the school age population | 1986; 1987; 1988 | Image/StillImage | uum_map |