The Health Education Assets Library (HEAL) is a collection of over 22,000 freely available digital materials for health sciences education. The collection is now housed at the University of Utah J. Willard Marriott Digital Library.
TO
Filters: Collection: ehsl_heal
| Title | Description | Subject | Collection | ||
|---|---|---|---|---|---|
| 51 |
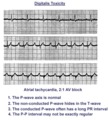 |
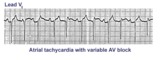
Atrial tachycardia with 2:1 AV block: a manifestation of digitalis intoxication | Atrial tachycardia with 2:1 AV block: a manifestation of digitalis intoxication | Knowledge Weavers ECG | |
| 52 |
 |
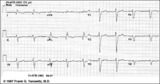
Atrial tachycardia with 3:2 AV block | In this rhythm the atrial rate from an ectopic focus is 160 bpm. Atrial activity can be seen on top of T waves, and before QRS's. Careful observation reveals a 3:2 Wenckebach relationship between P waves and QRS's. Atrial tachycardia with block is often a sign of digitalis intoxication. | Knowledge Weavers ECG | |
| 53 |
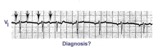 |
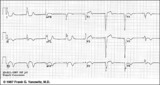
Atrial tachycardia with 3:2 and 2:1 AV block | The ectopic atrial rate is 150 bpm. Some of the ectopic P waves are easily seen and indicated by the arrows. Other P waves are burried in the T waves and not so easily identified. Atrial tachycardia with AV block is often a sign of digitalis intoxication. 3:2 and 2:1 AV block is seen in this examp... | Knowledge Weavers ECG | |
| 54 |
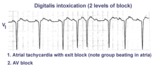 |
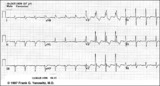
Atrial tachycardia with exit block and AV block | The ectopic P waves, easily seen in this example,occur in groups, separated by short pauses. This is likely due to an exit block just distal to the atrial pacemaker. Because not all of the P waves make it to the ventricles, there is also 2nd degree AV block. Therefore, two levels of block are pre... | Knowledge Weavers ECG | |
| 55 |
 |
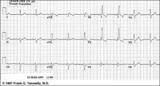
Atypical LBBB with Q waves in leads I and aVL | In typical LBBB, there are no initial Q waves in leads I, aVL, and V6. If Q waves are present in 2 or more of these leads, myocardial infarction is present. | Knowledge Weavers ECG | |
| 56 |
 |
Atypical LBBB with primary T wave abnormalities | Primary T wave abnormalities in LBBB refer to T waves in the same direction as the major deflection of the QRS. These are seen in leads I, III, aVL, V2-4. Most likely diagnosis is myocardial infarction. | Knowledge Weavers ECG | |
| 57 |
 |
Bifascicular block: RBBB + LAFB | Bifascicular block: RBBB + LAFB | Knowledge Weavers ECG | |
| 58 |
 |
Bifascicular block: RBBB + LAFB | This is the most common of the bifascicular blocks. RBBB is most easily recognized in the precordial leads by the rSR' in V1 and the wide S wave in V6 (i.e., terminal QRS forces oriented rightwards and anterior). LAFB is best seen in the frontal plane leads as evidenced by left axis deviation (-50... | Knowledge Weavers ECG | |
| 59 |
 |
Bradycardia-dependent LBBB with carotid sinus massage | When carotid sinus massage slows the heart rate in this example, the QRS widens into a LBBB. This form of rate-dependent bundle branch block is thought to be due to latent pacemakers in the bundle undergoing phase 4 depolarization; when the sinus impulse enters the partially depolarized bundle, slow... | Knowledge Weavers ECG | |
| 60 |
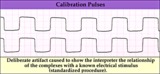 |
Calibration signal - marquette | Calibration signal - marquette | Knowledge Weavers ECG | |
| 61 |
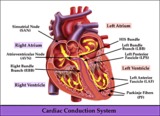 |
Cardiac conduction system diagram - marquette | Cardiac conduction system diagram - marquette | Knowledge Weavers ECG | |
| 62 |
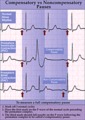 |
Compensatory vs. non-compensatory pauses - marquette | Compensatory vs. non-compensatory pauses - marquette | Knowledge Weavers ECG | |
| 63 |
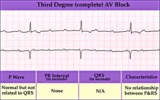 |
Complete AV block (3rd degree) with junctional rhythm | Complete AV block (3rd degree) with junctional rhythm | Knowledge Weavers ECG | |
| 64 |
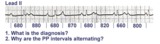 |
Complete AV block, junctional escape rhythm, and ventriculophasic sinus arrhythmia | Complete AV block is seen as evidenced by the AV dissociation. A junctional escape rhythm sets the ventricular rate at 45 bpm. The PP intervals vary because of ventriculophasic sinus arrhythmia; this is defined when the PP interval that includes a QRS is shorter than a PP interval that excludes a ... | Knowledge Weavers ECG | |
| 65 |
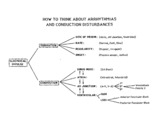 |
Conceptual framework: aArrhythmias and conduction abnormalities | Conceptual framework: aArrhythmias and conduction abnormalities | Knowledge Weavers ECG | |
| 66 |
 |
Diagram: frontal plane leads | Diagram: frontal plane leads | Knowledge Weavers ECG | |
| 67 |
 |
Diagram: stages of acute Q-wave MI | Diagram: stages of acute Q-wave MI | Knowledge Weavers ECG | |
| 68 |
 |
Diagram: type I vs. type II 2nd degree AV block | In type I 2nd degree AV block the PR progressively lengthens until a nonconducted P wave occurs. The PR gets longer by smaller and smaller increments; this results in gradual shortening of the RR intervals. The RR interval of the pause is usually less than the two preceding RR intervals. The RR i... | Knowledge Weavers ECG | |
| 69 |
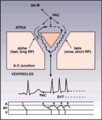 |
Diagram: AV nodal reentrant tachycardia | The AV node often has dual pathways; in this diagram the alpha pathway is fast, but has a long refractory period; the beta pathway is conducts more slowly, but recovers faster.In sinus rhythm the faster alpha pathway is used and accounts for the normal PR interval. When a PAC occurs, however, the i... | Knowledge Weavers ECG | |
| 70 |
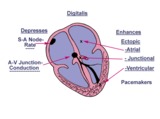 |
Diagram: digitalis effect on rhythm and conduction | Diagram: digitalis effect on rhythm and conduction | Knowledge Weavers ECG | |
| 71 |
 |
Diffuse anterolateral T wave abnormalities | Diffuse anterolateral T wave abnormalities | T Wave Abnormalities | Knowledge Weavers ECG |
| 72 |
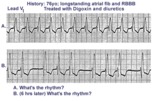 |
Digitalis intoxication: Junctional tachycardia with and without AV block | In a patient with longstanding atrial fibrillation being treated with digoxin, a regular tachycardia, as seen in A, with a RBBB suggests a junctional or supraventricular tachycardia. Group beating, in B, is likely due to a 2nd degree, Type 1, exit block below the ectopic junctional focus. This is h... | Knowledge Weavers ECG | |
| 73 |
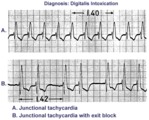 |
Digitalis intoxication: junctional tachycardia with and without exit block | In A the rhythm is junctional tachycardia with RBBB. In B there is 2nd degree exit block with a 3:2 conduction ratio; i.e., every 3rd junctional impulse fails to reach the ventricles... at least for the first two groupings on 1.4sec. | Knowledge Weavers ECG | |
| 74 |
 |
ECG components diagram - marquette | ECG components diagram - marquette | Knowledge Weavers ECG | |
| 75 |
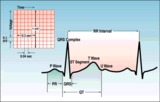 |
ECG intervals and waves | The P wave represents atrial activation; the PR interval is the time from onset of atrial activation to onset of ventricular activation. The QRS complex represents ventricular activation; the QRS duration is the duration of ventricular activation. The ST-T wave represents ventricular repolarizatio... | Knowledge Weavers ECG |