Home
Browse
Ask Us
Chat
Harmful Language Statement
Log in
Advanced Search
Year
1984
1985
1986
1987
1988
1989
1990
1991
1992
1993
1994
1995
1996
1997
1998
1999
2000
2001
2002
2003
2004
2005
2006
2007
2008
2009
2010
2011
2012
2013
2014
2015
2016
2017
2018
2019
2020
2021
2022
2023
2024
2025
2026
TO
1984
1985
1986
1987
1988
1989
1990
1991
1992
1993
1994
1995
1996
1997
1998
1999
2000
2001
2002
2003
2004
2005
2006
2007
2008
2009
2010
2011
2012
2013
2014
2015
2016
2017
2018
2019
2020
2021
2022
2023
2024
2025
2026
Type
Text
306
Image
7
Format
application/pdf
341
image/jpeg
1
video/mp4
1
Institution
Institutional Repository
302
University of Utah Partnerships
13
University of Utah Marriott Library
12
Eccles Health Sciences Library
10
Department of Cultural and Community ...
3
Westminster University
3
More
Collection
American Flame Research Committee
4
Computer Science Archive
5
Department of City and Metropolitan P...
3
Discovery and Innovation at Universit...
1
Electronic University Archive
8
Everett L. Cooley Oral History Project
1
GApp Lab Wrap Kits
1
Graduate Nursing Project
2
Hinckley Journal of Politics
1
Honors Theses Open Access
26
Illuminations
3
Kem C. Gardner Policy Institute Colle...
3
Land Use - Transportation Scenario Pl...
3
Let Freedom Read Dress
1
MFA Final Projects
2
Marriott Digital Publishing Archive
1
Maud May Babcock Papers
6
Media Resources
1
Medical Home Portal Archive
1
NOVEL - NANOS Annual Meeting
1
Office of Undergraduate Research Library
5
Public Affairs of Health Sciences Center
1
Salt Lake Climbers Alliance
1
Sustainability U
2
Theses & Dissertations
133
UScholar Works
114
Undergrad Research Abstracts Journal
4
Utah COVID-19
3
Utah Historic Building Records
3
Westminster University Institutional ...
3
More
26
-
50
of
343
<
1
2
3
4
5
6
7
8
9
10
>
Gallery view
Number of results to display per page
10
25
50
100
200
Sort by Relevance
Sort by Title A-Z
Sort by Title Z-A
Sort by Date Ascending
Sort by Date Descending
Sort by Last Modified Ascending
Sort by Last Modified Descending
Title
Date
Type
Setname
26
Page 13
ir_computersa
27
Page 29
uum_mmbp
28
Page 52
ir_computersa
29
Page 80
ir_etd
30
Towards enabling social analysis of scientific data
2008
Text
ir_uspace
31
Visualizing data: why an (interactive) picture is worth 1000 numbers
2012-09-05
Text
ir_uspace
32
Page 20
uu_afrc
33
Page 22
ir_computersa
34
Page 261
dha_uhbr
35
Normative modeling of early brain maturation from longitudinal DTI reveals twin-singleton differences
2014-01-01
Text
ir_uspace
36
Depth-based visualizations for ensemble data and graphs
2018
Text
ir_etd
37
2019 Climb-a-Mile review
2019
Image
uum_slca
38
Page 31
uum_mmbp
39
Page 33
uum_mmbp
40
Page 35
uum_mmbp
41
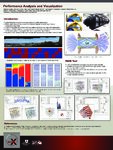
Performance Analysis and Visualization
2012
Text
ir_uspace
42
Interactive volume rendering of large datasets using the silicon graphics Onyx4 visualization system
2005
Text
ir_uspace
43
Computer simulation and visualization in medicine
2000
Text
ir_uspace
44
Page 57
uu_lu_tsp
45
Page 9
uu_lu_tsp
46
Supporting scientific reasoning about real-world phenomena
2019
Text
ir_etd
47
Page 334
ir_eua
48
Computational field visualization
2001
Text
ir_uspace
49
Interactive volume rendering of large datasets using the silicon graphics Onyx4 visualization system
2004-01-27
Text
ir_uspace
50
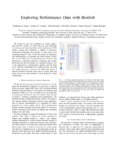
Exploring performance data with boxfish
2012-01-01
Text
ir_uspace
26
-
50
of
343
<
1
2
3
4
5
6
7
8
9
10
>