Over 70,000 photos covering a variety of topics from Marriott Library Special Collections
TO
| Title | Collection Number And Name | Photo Number | ||
|---|---|---|---|---|
| 26 |
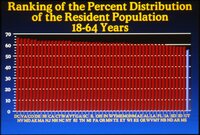 |
Ranking of the percent distribution of the resident population 18-64 years | P0484 Taxpayers for Utah photograph collection | P0484n01_01_005 |
| 27 |
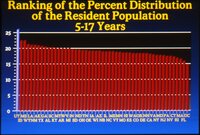 |
Ranking of the percent distribution of the resident population 5-17 years | P0484 Taxpayers for Utah photograph collection | P0484n01_01_020 |
| 28 |
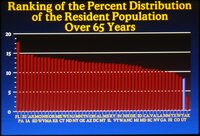 |
Ranking of the percent distribution of the resident population over 65 years | P0484 Taxpayers for Utah photograph collection | P0484n01_01_009 |
| 29 |
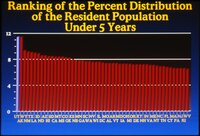 |
Ranking of the percent distribution of the resident population under 5 years | P0484 Taxpayers for Utah photograph collection | P0484n01_01_016 |
| 30 |
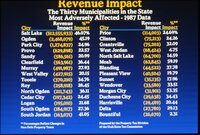 |
Revenue Impact | P0484 Taxpayers for Utah photograph collection | P0484n01_01_026 |
| 31 |
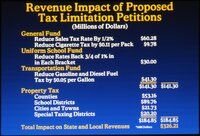 |
Revenue impact of proposed tax limitation petitions | P0484 Taxpayers for Utah photograph collection | P0484n01_01_004 |
| 32 |
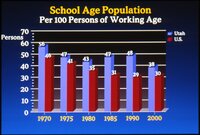 |
School age population per 100 persons of working age 1970-2000 | P0484 Taxpayers for Utah photograph collection | P0484n01_01_006 |
| 33 |
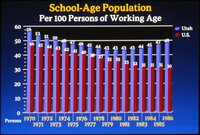 |
School-age population 1970-1986 | P0484 Taxpayers for Utah photograph collection | P0484n01_01_021 |
| 34 |
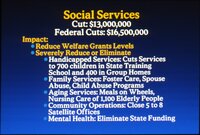 |
Social services | P0484 Taxpayers for Utah photograph collection | P0484n01_01_032 |
| 35 |
 |
Southern Utah State College | P0484 Taxpayers for Utah photograph collection | P0484n01_01_025 |
| 36 |
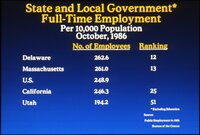 |
State and local government full-time employment | P0484 Taxpayers for Utah photograph collection | P0484n01_01_027 |
| 37 |
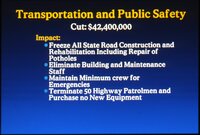 |
Transportation and public safety | P0484 Taxpayers for Utah photograph collection | P0484n01_01_036 |
| 38 |
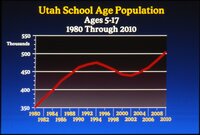 |
Utah school age population | P0484 Taxpayers for Utah photograph collection | P0484n01_01_022 |
| 39 |
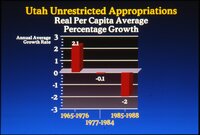 |
Utah unrestricted appropriations | P0484 Taxpayers for Utah photograph collection | P0484n01_01_031 |
| 40 |
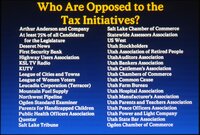 |
Who are opposed to the tax initiatives? | P0484 Taxpayers for Utah photograph collection | P0484n01_01_003 |
| 41 |
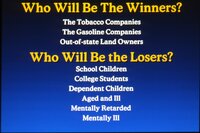 |
Who will be the winners? | P0484 Taxpayers for Utah photograph collection | P0484n01_01_035 |
| 42 |
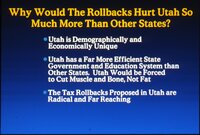 |
Why would the rollbacks hurt Utah so much more than other states? | P0484 Taxpayers for Utah photograph collection | P0484n01_01_012 |