| Title | Date | Type | Setname | ||
|---|---|---|---|---|---|
| 1 |
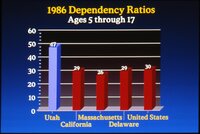 |
1986 dependency ratios | 1986; 1987; 1988 | Image/StillImage | uum_map |
| 2 |
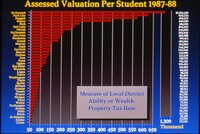 |
Assessed valuation per student | 1986; 1987; 1988 | Image/StillImage | uum_map |
| 3 |
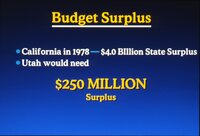 |
Budget surplus | 1986; 1987; 1988 | Image/StillImage | uum_map |
| 4 |
 |
Contact sheet of individual and group photos from Taxpayers for Utah press conference | 1988-09 | Image/StillImage | uum_map |
| 5 |
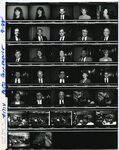 |
Contact sheet of individual and group photos from Taxpayers for Utah press conference | 1988-09 | Image/StillImage | uum_map |
| 6 |
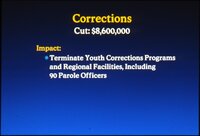 |
Corrections | 1986; 1987; 1988 | Image/StillImage | uum_map |
| 7 |
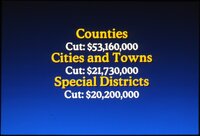 |
Counties, Cities and Towns, Special Districts | 1986; 1987; 1988 | Image/StillImage | uum_map |
| 8 |
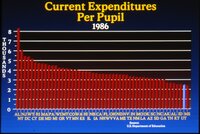 |
Current expenditures per pupil | 1986; 1987; 1988 | Image/StillImage | uum_map |
| 9 |
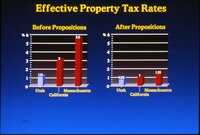 |
Effective property tax rates | 1986; 1987; 1988 | Image/StillImage | uum_map |
| 10 |
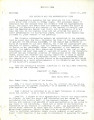 |
The Governor and the appropriation bill | 1884-03-15 | Text | uum_jhmp |
| 11 |
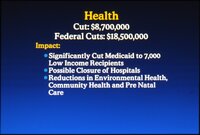 |
Health | 1986; 1987; 1988 | Image/StillImage | uum_map |
| 12 |
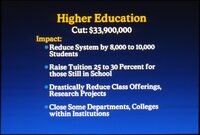 |
Higher education | 1986; 1987; 1988 | Image/StillImage | uum_map |
| 13 |
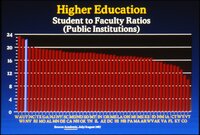 |
Higher education student to faculty ratios | 1986; 1987; 1988 | Image/StillImage | uum_map |
| 14 |
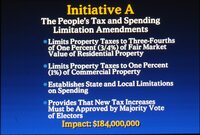 |
Initiative A | 1986; 1987; 1988 | Image/StillImage | uum_map |
| 15 |
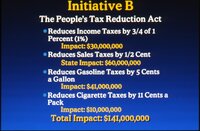 |
Initiative B | 1986; 1987; 1988 | Image/StillImage | uum_map |
| 16 |
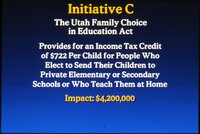 |
Initiative C | 1986; 1987; 1988 | Image/StillImage | uum_map |
| 17 |
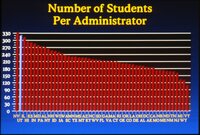 |
Number of students per administrator | 1986; 1987; 1988 | Image/StillImage | uum_map |
| 18 |
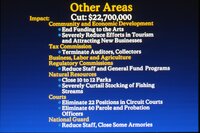 |
Other areas | 1986; 1987; 1988 | Image/StillImage | uum_map |
| 19 |
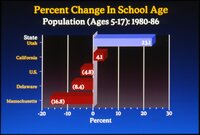 |
Percent change in school age | 1986; 1987; 1988 | Image/StillImage | uum_map |
| 20 |
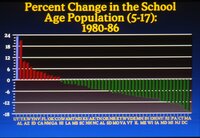 |
Percent change in the school age population | 1986; 1987; 1988 | Image/StillImage | uum_map |
| 21 |
 |
Prescribing for the body politic: suggestions for legislative-administrative adjustments in the government of Utah | 1951 | Text | uu_fwrl |
| 22 |
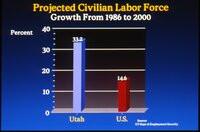 |
Projected civilian labor force | 1986; 1987; 1988 | Image/StillImage | uum_map |
| 23 |
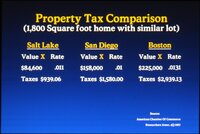 |
Property tax comparison | 1986; 1987; 1988 | Image/StillImage | uum_map |
| 24 |
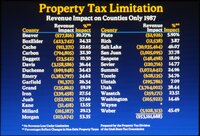 |
Property tax limitation | 1986; 1987; 1988 | Image/StillImage | uum_map |
| 25 |
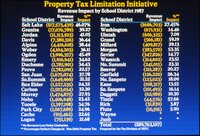 |
Property tax limitation initiative | 1986; 1987; 1988 | Image/StillImage | uum_map |
| 26 |
 |
Property taxes charged in Utah | 1986; 1987; 1988 | Image/StillImage | uum_map |
| 27 |
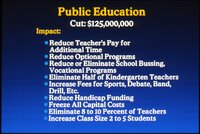 |
Public education | 1986; 1987; 1988 | Image/StillImage | uum_map |
| 28 |
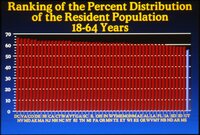 |
Ranking of the percent distribution of the resident population 18-64 years | 1986; 1987; 1988 | Image/StillImage | uum_map |
| 29 |
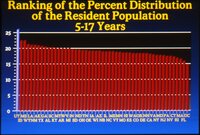 |
Ranking of the percent distribution of the resident population 5-17 years | 1986; 1987; 1988 | Image/StillImage | uum_map |
| 30 |
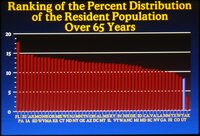 |
Ranking of the percent distribution of the resident population over 65 years | 1986; 1987; 1988 | Image/StillImage | uum_map |
| 31 |
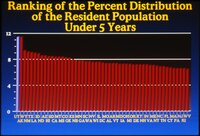 |
Ranking of the percent distribution of the resident population under 5 years | 1986; 1987; 1988 | Image/StillImage | uum_map |
| 32 |
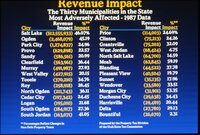 |
Revenue Impact | 1986; 1987; 1988 | Image/StillImage | uum_map |
| 33 |
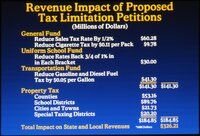 |
Revenue impact of proposed tax limitation petitions | 1986; 1987; 1988 | Image/StillImage | uum_map |
| 34 |
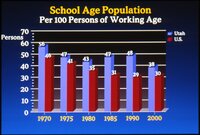 |
School age population per 100 persons of working age 1970-2000 | 1986; 1987; 1988 | Image/StillImage | uum_map |
| 35 |
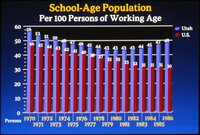 |
School-age population 1970-1986 | 1986; 1987; 1988 | Image/StillImage | uum_map |
| 36 |
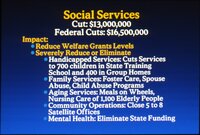 |
Social services | 1986; 1987; 1988 | Image/StillImage | uum_map |
| 37 |
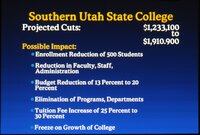 |
Southern Utah State College | 1986; 1987; 1988 | Image/StillImage | uum_map |
| 38 |
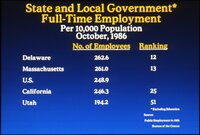 |
State and local government full-time employment | 1986; 1987; 1988 | Image/StillImage | uum_map |
| 39 |
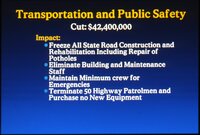 |
Transportation and public safety | 1986; 1987; 1988 | Image/StillImage | uum_map |
| 40 |
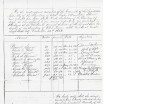 |
Travel voucher for payment of mileage to Legislative Assembly (1863) | 1864-01-26 | Text | uum_uhrf |
| 41 |
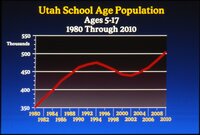 |
Utah school age population | 1986; 1987; 1988 | Image/StillImage | uum_map |
| 42 |
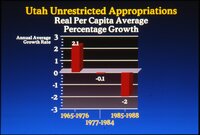 |
Utah unrestricted appropriations | 1986; 1987; 1988 | Image/StillImage | uum_map |
| 43 |
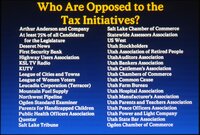 |
Who are opposed to the tax initiatives? | 1986; 1987; 1988 | Image/StillImage | uum_map |
| 44 |
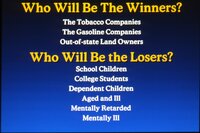 |
Who will be the winners? | 1986; 1987; 1988 | Image/StillImage | uum_map |
| 45 |
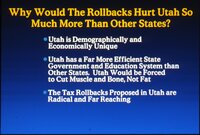 |
Why would the rollbacks hurt Utah so much more than other states? | 1986; 1987; 1988 | Image/StillImage | uum_map |
| 46 |
 |
William H. King, U.S. Senator | 1935; 1936; 1937; 1938; 1939; 1940; 1941; 1942; 1943; 1944; 1945 | Text | dha_wpabs |