|
|
Date | Title | DOI |
| 1 |
 |
2020 | 2020 Report to the Community | 10.7278/S5d-m6kj-qvq5 |
| 2 |
 |
2022 | 2030 Olympic and Paralympic winter games in Utah estimated economic and fiscal impact | 10.7278/S5d-n6h4-feha |
| 3 |
 |
2023 | 2030 Olympic and Paralympic winter games in Utah: demographic, social, and environmental factors | 10.7278/S5d-cs84-5bkx |
| 4 |
 |
2022 | A blueprint for growing Salt Lake City's health care innovation economy | DOI 10.7278/S5d-6rzt-8tfq |
| 5 |
 |
2022 | A business vision for Utah's energy future | 10.7278/S5d-e10g-4paj |
| 6 |
 |
2022 | A cloudy Crystal Ball pandemic forecasting challenges highlight need for budget relief valves | DOI 10.7278/S5d-t6q9-9s1d |
| 7 |
 |
2023 | A comparison of State-funded affordable housing programs | DOI 10.7278/S5d-e9r1-2h9b |
| 8 |
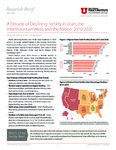 |
2022 | A Decade of Declining Fertility in Utah, the Intermountain West, and the Nation: 2010-2020 | 10.7278/S5d-7285-8x4d |
| 9 |
 |
2023 | A Look into the 2010-2020 decline in Salt Lake City's youth population | 10.7278/S5d-1h1k-yrb3 |
| 10 |
 |
2020 | A roadmap for improving Utah's behavioral health system | 10.7278/S5d-ds0n-fw98 |
| 11 |
 |
2021 | A roadmap for improving Utah's behavioral health system | 10.7278/S5d-89t5-t0jr |
| 12 |
 |
2023 | A synthesized resource document for the 2023 General Legislative Session | DOI 10.7278/S5d-vske-kn9e |
| 13 |
 |
2023 | A visual guide to tax modernization in Utah Part four: individual income tax | 10.7278/S5d-3vtw-p9d8 |
| 14 |
 |
2022 | A visual guide to tax modernization in Utah part three: understanding property taxes | 10.7278/S5d-3x3h-7ryd |
| 15 |
 |
2022 | Accuracy analysis of long-term planning projections for Utah and its counties | 10.7278/S5d-re24-jzy5 |
| 16 |
 |
2022 | An economic analysis of Utah's direct selling industry | 10.7278/S5d-s56e-rrk0 |
| 17 |
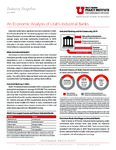 |
2020 | An economic analysis of Utah's industrial banks | 10.7278/S5d-czms-gma5 |
| 18 |
 |
2020 | An economic analysis of Utah's industrial banks | 10.7278/S5d-y92a-0wzp |
| 19 |
 |
2023 | An economic overview for Utah and U.S. | 10.7278/S5d-gmvx-mp4e |
| 20 |
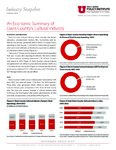 |
2023 | An economic summary of Davis County's cultural industry | 10.7278/S5d-hpyg-savq |
| 21 |
 |
2023 | An economic summary of Salt Lake County's cultural industry | 10.7278/S5d-0hwb-whf6 |
| 22 |
 |
2022 | An economic summary of Utah's arts, culture, and entertainment industry | 10.7278/S5d-v66r-t342 |
| 23 |
 |
2024 | An economic summary of Utah's cultural arts industry, 2022 | 10.7278/S5d-1nfq-4cmk |
| 24 |
 |
2023 | An economic summary of Utah's cultural industry | 10.7278/S5d-as8m-c93g |
| 25 |
 |
2023 | An economic summary of Washington County's cultural industry | 10.7278/S5d-wy6j-628t |
| 26 |
 |
2020 | An historic overview of office, industrial, and retail development and their recent demand drivers in Salt Lake City | DOI 10.7278/S5d-1x58-kz1f |
| 27 |
 |
2024 | Banking and financial services | 10.7278/S5d-4pr3-exmc |
| 28 |
 |
2019 | Beaver County population by age, sex, race and ethnicity, 2010-2018 | DOI 10.7278/S5d-zqxt-prww |
| 29 |
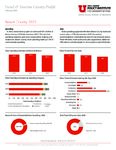 |
2022 | Beaver County, 2020 | 10.7278/S5d-gvzr-p4mg |
| 30 |
 |
2023 | Beaver County, 2022 | 10.7278/S5d-z6f1-bev8 |
| 31 |
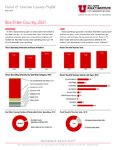 |
2023 | Box Elder County, 2021 | 10.7278/S5d-maew-r1ve |
| 32 |
 |
2022 | The changing dynamics of the Wasatch Front apartment market | 10.7278/S5d-e4b6-6jxd |
| 33 |
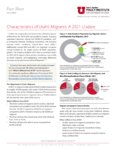 |
2023 | Characteristics of Utah's migrants: a 2021 update | 10.7278/S5d-33rm-24x3 |
| 34 |
 |
2023 | The Covid-19 State sales tax windfall | 10.7278/S5d-7yam-5tnm |
| 35 |
 |
2023 | Data compendium Utah strategic energy framework | 10.7278/S5d-xvzt-p2pc |
| 36 |
 |
2023 | Demographic impacts of zero migration in Utah - a projection scenario | 10.7278/S5d-4hgp-chaw |
| 37 |
 |
2023 | Demographic inputs for Utah's long-term baseline and scenario planning projections | 10.7278/S5d-4esb-v3c7 |
| 38 |
 |
2023 | The dignity index Utah pilot project technical summary | 10.7278/S5d-sxkw-sgjc |
| 39 |
 |
2021 | Diversity in Utah race, ethnicity, and sex | 10.7278/S5d-w3ez-99hc |
| 40 |
 |
2023 | Econimic impacts of Utah's life sciences and health care innovation industry | 10.7278/S5d-tyj0-yh2b |
| 41 |
 |
2022 | Economic challenges and opportunities in Utah's coal Country | 10.7278/S5d-8gx4-fyhh |
| 42 |
 |
2020 | Economic contribution of University of Utah health | DOI 10.7278/S5d-347p-kmze |
| 43 |
 |
2018 | The economic contribution of Utah's life science industry | DOI 10.7278/S5d-qcvf-5rqk |
| 44 |
 |
2017 | Economic impacts of Utah's energy industry, 2017 | DOI 10.7278/S5d-28vn-5enc |
| 45 |
 |
2020 | Economic report to the Governor | DOI 10.7278/S5d-6nha-pypg |
| 46 |
 |
2023 | Economic report to the governor highlights | 10.7278/S5d-rhh4-5917 |
| 47 |
 |
2024 | Economic report to the governor highlights | 10.7278/S5d-xx4w-hkbm |
| 48 |
 |
2023 | El nuevo Utah Guardianes De La llama | 10.7278/S5d-knnv-jhnk |
| 49 |
 |
2022 | Experimental age, sex, race and ethnicity projections for every State for 2030, with scenarios | 10.7278/S5d-0hsw-0xnf |
| 50 |
 |
2016-10 | Fertility in Utah since the Great Recession: the new normal or a pregnant pause? | 10.26052/0D-7CV1-X4J0 |
| 51 |
 |
2023 | First insights - 2020 census demographic and housing characteristic file | 10.7278/S5d-bk6s-wmr5 |
| 52 |
 |
2020 | Frequently asked questions about CO2 emissions | 10.7278/S5d-tdqa-fxak |
| 53 |
 |
2023 | From Strength to Strength a conversation with Arthur Brooks | 10.7278/S5d-br5b-9p6w |
| 54 |
 |
2021 | Growth trends in Utah's life sciences industry | 10.7278/S5d-t00w-shfj |
| 55 |
 |
2021 | Growth trends in Utah's life sciences industry | 10.7278/S5d-kdv9-es5s |
| 56 |
 |
2023 | Guardians de la llama, October de 2023 | 10.7278/S5d-8hxg-96bb |
| 57 |
 |
2023 | Hachman index of economic diversity, 2021 | 10.7278/S5d-b6gv-3d0c |
| 58 |
 |
2023 | Housing prices and affordability | 10.7278/S5d-jz8e-pcec |
| 59 |
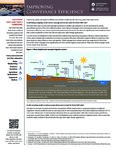 |
2023 | Improving conveyance efficiency | DOI 10.7278/S5d-89wk-bdn2 |
| 60 |
 |
2023 | Income tax lnsights | DOI 10.7278/S5d-f7de-bc9d |
| 61 |
 |
2023 | Informed decision™ maker of the year | 10.7278/S5d-94jr-znrt |
| 62 |
 |
2020 | Is Utah's relatively low COVID-19 death rate due to its younger population? | 10.26052/0D-HZXM-JGQV |
| 63 |
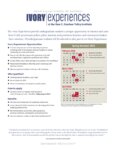 |
2020 | Ivory experiences | DOI 10.7278/S5d-4abm-fwmc |
| 64 |
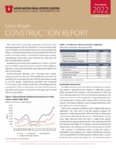 |
2022 | Ivory-Boyer Construction Report | 10.7278/S5d-2cga-tceb |
| 65 |
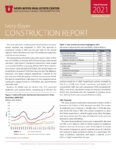 |
2022 | Ivory-Boyer Construction Report | 10.7278/S5d-prwk-7s3w |
| 66 |
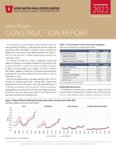 |
2022 | Ivory-Boyer Construction Report | 10.7278/S5d-qyyx-xrcy |
| 67 |
 |
2019 | Ivory-Boyer construction report | DOI 10.7278/S5d-ve6d-f4tw |
| 68 |
 |
2020 | Ivory-Boyer construction report | DOI 10.7278/S5d-cb3b-ctmf |
| 69 |
 |
2022 | Ivory-Boyer Construction Report | 10.7278/S5d-q842-rmqp |
| 70 |
 |
2023 | K-12 Teacher Shortage, retention, and salaries in Utah | DOI 10.7278/S5d-zvpt-2fpk |
| 71 |
 |
2024 | Lake Partitioning and other playa modifications | DOI 10.7278/S5d-9mnh-m3s6 |
| 72 |
 |
2022 | Long-Term planning projection scenarios | 10.7278/S5d-k7vw-8bgs |
| 73 |
 |
2020 | Measuring economic diversity: The hachman index, 2018 | DOI 10.7278/S5d-fa2c-73bp |
| 74 |
 |
2023 | Medicaid: what is FMAP and why does it matter? | 10.7278/S5d-ehgs-a2g9 |
| 75 |
 |
2022 | Methodology - zero net migration simulation using cohort change ratios | DOI 10.7278/S5d-xhp0-r6cc |
| 76 |
 |
2020 | Moving toward 2020: Utah commuting patterns, 2000 to 2010 | DOI 10.7278/S5d-af9s-2q12 |
| 77 |
 |
2020 | Moving toward evidence-based programs: medication-assisted treatment for opioid use disorder in Utah | 10.7278/S5d-h8rn-m804 |
| 78 |
 |
2023 | NBA All-Star weekend talking points | 10.7278/S5d-dews-sxn4 |
| 79 |
 |
2020 | New Americans in Salt Lake County | 10.7278/S5d-f2dn-xneh |
| 80 |
 |
2023 | The new Utah keepers of the flame | 10.7278/S5d-hgzd-g76n |
| 81 |
 |
2023 | The new Utah keepers of the flame: October, 2023 | 10.7278/S5d-r8c9-nfvq |
| 82 |
 |
2023 | The new Utah keepers of the flame: v.1 | 10.7278/S5d-x6s1-64sf |
| 83 |
 |
2023 | Opportunity knocks the fiscal impacts of declining school-age population in Utah | 10.7278/S5d-gm9d-2d5b |
| 84 |
 |
2024 | Optimize water pricing | 10.7278/S5d-tweg-rhsj |
| 85 |
 |
2019 | Oquirrh view existing conditions report Salt Lake County, Utah 2019 | 10.7278/S5d-9cf5-s11a |
| 86 |
 |
2024 | Payment in Lieu of Taxes (Pilot) program | DOI 10.7278/S5d-tweg-rhsj |
| 87 |
 |
2022 | Point of the Mountain buildout scenarios economic and fiscal contributions | 10.7278/S5d-zkt0-690v |
| 88 |
 |
2023 | Policy options for post-pandemic eviction prevention | 10.7278/S5d-2njn-cej0 |
| 89 |
 |
2023 | Preschool Development grant summary report | 10.7278/S5d-x095-1x1e |
| 90 |
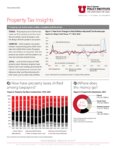 |
2022 | Property Tax insights | 10.7278/S5d-scga-jxes |
| 91 |
 |
2023 | Public health practice: effective technical assistance modalities to support chronic disease prevention programming | 10.7278/S5d-kfdh-0b1h |
| 92 |
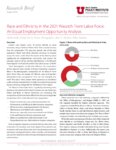 |
2022 | Race and ethnicity in the 2021 Wasatch front labor force: an equal employment opportunity analysis | 10.7278/S5d-w2mr-cc9h |
| 93 |
 |
2018 | Race/ethnicity in the 2018 Wasatch front labor force: an equal employment opportunity analysis | 10.7278/S5d-fvtz-y7dg |
| 94 |
 |
2023 | Refugees in Utah | 10.7278/S5d-f9dz-mhk1 |
| 95 |
 |
2023 | Relational health: the connection between adult and childhood mental health | 10.7278/S5d-sepk-q3jt |
| 96 |
 |
2023 | Relational health: the connection between adult and childhood mental health | 10.7278/S5d-z8rt-c780 |
| 97 |
 |
2022 | Renewable natural gas: a sustainable approach to the energy transition | 10.7278/S5d-wc8b-4f6q |
| 98 |
 |
2021 | Renewable natural gas: a sustainable approach to the energy transition | 10.7278/S5d-5wpf-cxvf |
| 99 |
 |
2024 | The road to prosperity dashboard tracks Utah's economic outlook. The dashboard, which is updated monthly, provides essential insights, tracks timely and leading measures, and shares salient indicators. | 10.7278/S5d-w7ep-1wpz |
| 100 |
 |
2023 | The road to prosperity dashboard tracks Utah's economic outlook. The dashboard, which is updated monthly, provides essential insights, tracks timely and leading measures, and shares salient indicators. | 10.7278/S5d-w7ep-1wpz |
| 101 |
 |
2023 | The road to prosperity dashboard tracks Utah's economic outlook. The dashboard, which is updated monthyly, provides essential insights, tracks timely and leading measures, and shares salient indicators. | 10.7278/S5d-9pq4-p5xv |
| 102 |
 |
2024 | The role of nonprofit hospitals in Utah's health care system | 10.7278/S5d-d6te-sngx |
| 103 |
 |
2020 | Salt Lake and Utah County subcounty estimates, 2010-2019 | 10.7278/S5d-9pry-9a6d |
| 104 |
 |
2022 | Salt Lake City 2022 data book | 10.7278/S5d-mwt0-7fs0 |
| 105 |
 |
2023 | Salt Lake City's foreign-born residents: demographics of a dynamic population | 10.7278/S5d-bbcx-59z6 |
| 106 |
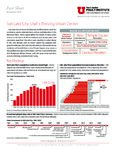 |
2023 | Salt Lake City: Utah's thriving urban center | 10.7278/S5d-kkjz-qq08 |
| 107 |
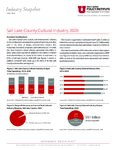 |
2022 | Salt Lake County cultural industry, 2020 | 10.7278/S5d-rxvn-67nw |
| 108 |
 |
2020 | Salt Lake County renter demographics | 10.7278/S5d-ar7g-weca |
| 109 |
 |
2023 | Sat Lake County's historic apartment boom: past, present, and future | 10.7278/S5d-6574-7kty |
| 110 |
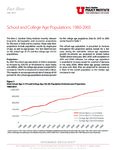 |
2017 | School and College age populations: 1980-2065 | 10.7278/S5d-f5s7-fpc1 |
| 111 |
 |
2024 | Shifting households: decadal growth and change in Salt Lake City | 10.7278/S5d-w88a-4r5a |
| 112 |
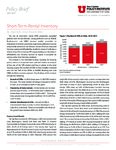 |
2022 | Short-term-rental Inventory | 10.7278/S5d-fgz4-a3n3 |
| 113 |
 |
2023 | State and County population estimates FAQ | 10.7278/S5d-na2g-as6k |
| 114 |
 |
2022 | State and County population estimates for Utah: 2022 | 10.7278/S5d-6phn-2jyf |
| 115 |
 |
2023 | State and County population estimates for Utah: 2023 | 10.7278/S5d-hxxk-mnqk |
| 116 |
 |
2023 | State of the State's housing market, 2022-2024 | 10.7278/S5d-rrky-jw5z |
| 117 |
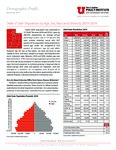 |
2019 | State of Utah population by age, sex, race and ethnicity, 2010-2018 | 10.7278/S5d-mqw4-f2vj |
| 118 |
 |
2023 | The State of Utah's travel and tourism industry | 10.7278/S5d-6dt2-hnk5 |
| 119 |
 |
2022 | The State of Utah's travel and tourism industry | 10.7278/S5d-qz5z-pgm7 |
| 120 |
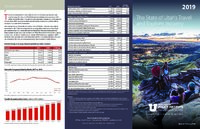 |
2019 | The State of Utah's travel and tourism industry | 10.7278/S5d-262z-x67n |
| 121 |
 |
2021 | The State of Utah's travel and tourism industry 2020 | 10.7278/S5d-a1xt-rgk9 |
| 122 |
 |
2023 | The State of Utah's travel and tourism industry 2021 | 10.7278/S5d-wey9-287a |
| 123 |
 |
2023 | The State of Utah's travel and tourism industry, 2023 | 10.7278/S5d-ghpm-9f9s |
| 124 |
 |
2024 | The State of Utah's travel and tourism industry, 2024 | 10.7278/S5d-6k0d-36ph |
| 125 |
 |
| The Strike team offers six major insights and recommendations | DOI 10.7278/S5d-m5t2-kv50 |
| 126 |
 |
2020 | Survey of Utah's top homebuilders | 10.7278/S5d-yhe8-wgem |
| 127 |
 |
2022 | U.S. and Utah debt policy: a study in contrasts | 10.7278/S5d-kyj6-pnrx |
| 128 |
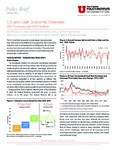 |
2024 | U.S. and Utah economic overview | 10.7278/S5d-sh1p-daxj |
| 129 |
 |
2023 | U.S. Census Bureau Estimates by County, 2022 | 10.7278/S5d-8n58-wcpp |
| 130 |
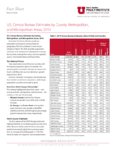 |
2020 | U.S. census bureau estimates by County, metropolitan, and micropolitan areas, 2019 | 10.7278/S5d-xt8e-1y54 |
| 131 |
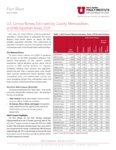 |
2022 | U.S. census Bureau Estimates by County, Metropolitan, and Micropolitan Areas, 2021 | 10.7278/S5d-xz22-kdv6 |
| 132 |
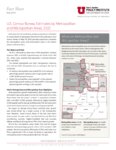 |
2023 | U.S. Census Bureau Estimates by Metropolitan and Micropolitan Areas, 2022 | 10.7278/S5d-dvgv-sn2y |
| 133 |
 |
2020 | U.S. census bureau estimates for age, sex, race and Hispanic origin vintage 2019: age | 10.7278/S5d-3p5j-2w7s |
| 134 |
 |
2022 | U.S. census bureau estimates for age, vintage 2021 | 10.7278/S5d-k2h3-jem0 |
| 135 |
 |
2023 | U.S. Census Bureau estimates for age, vintage 2022 | 10.7278/S5d-v7xc-szhg |
| 136 |
 |
| U.S. census Bureau Estimates for Cities and housing units, 2022 | 10.7278/S5d-vbw7-vgf5 |
| 137 |
 |
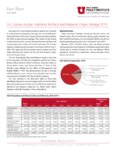
2020 | U.S. census bureau estimates for Cities and housing Units, Vintage 2019 | 10.7278/S5d-fbfp-n8bn |
| 138 |
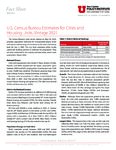 |
2022 | U.S. Census Bureau estimates for cities and housing units, vintage 2021 | 10.7278/S5d-mxa3-a0zp |
| 139 |
 |
2020 | U.S. Census Bureau estimates for race and Hispanic Origin, Vintage 2019 | 10.7278/S5d-96br-fqek |
| 140 |
 |
2022 | U.S. census bureau estimates for race and hispanic origin, Vintage 2021 | 10.7278/S5d-ephn-392r |
| 141 |
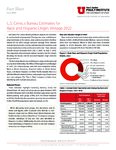 |
2023 | U.S. Census Bureau estimates for race and Hispanic Origin, Vintage 2022 | 10.7278/S5d-7ypb-m20p |
| 142 |
 |
2023 | U.S. economic indicators | 10.7278/S5d-acrq-18w6 |
| 143 |
 |
2022 | The unprecedented federal fiscal policy response to the COVID-19 pandemic and its impact on State budgets | 10.7278/S5d-52hc-bz9w |
| 144 |
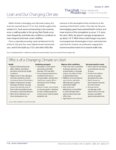 |
2020 | Utah and our changing climate | DOI 10.7278/S5d-3jz1-vxw9 |
| 145 |
 |
2024 | Utah and U.S. consumer sentiment fell slightly in February | 10.7278/S5d-6j99-3h9p |
| 146 |
 |
2024 | Utah behavioral health assessment & master plan | 10.7278/S5d-1prk-djqq |
| 147 |
 |
2023 | Utah behavioral health assessment & master plan | 10.7278/S5d-5z1q-fsd7 |
| 148 |
 |
2023 | Utah Consumer Sentiment | 10.7278/S5d-rphe-er31 |
| 149 |
 |
2017 | The Utah demographic and economic model | 10.26052/0D-MXMC-K7XZ |
| 150 |
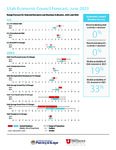 |
2023 | Utah economic council forecast | DOI 10.7278/S5d-ajd7-h7rc |
| 151 |
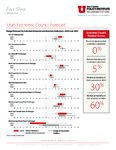 |
2023 | Utah Economic Council forecast | DOI 10.7278/S5d-mxvt-4fq7 |
| 152 |
 |
2023 | Utah Economic Council forecast - September 2023 | 10.7278/S5d-98se-0g29 |
| 153 |
 |
2023 | Utah Economic Council forecast for selected economic and business indicators, 2024 and 2025 | 10.7278/S5d-7hv6-8010 |
| 154 |
 |
2022 | Utah economic impacts from Utah retirement; systems 2021 pension; payments | 10.7278/S5d-5m19-d0g2 |
| 155 |
 |
2022 | Utah informed visual intellection for 2022 | 10.7278/S5d-8xjz-92hs |
| 156 |
 |
2023 | Utah informed visual intellection for 2023 | 10.7278/S5d-3ck1-8zww |
| 157 |
 |
2024 | Utah informed visual intellection for 2024 | 10.7278/S5d-9ydt-j8vh |
| 158 |
 |
2022 | Utah long-term planning projections | 10.7278/S5d-2zxg-2732 |
| 159 |
 |
2019 | Utah on the move: State and County migration age patterns | 10.7278/S5d-c7f4-whkg |
| 160 |
 |
2023 | Utah population committee estimates methodology: estimates for 2020 and beyond | 10.7278/S5d-p33z-b09c |
| 161 |
 |
2024 | Utah population committee estimates methodology: estimates for 2020 and beyond | 10.7278/S5d-cxpn-m0y7 |
| 162 |
 |
2023 | Utah population committee postcensal estimates accuracy analysis, 2010-2020 | 10.7278/S5d-pf9p-5s7n |
| 163 |
 |
2022 | Utah resident opinions on tourism: local area survey results | 10.7278/S50d-r2yt-h4ea |
| 164 |
 |
2022 | Utah resident opinions on tourism: statewide survey results | 10.7278/S5d-y956-4prx |
| 165 |
 |
2020 | The Utah roadmap positive solutions on climate and air quality | 10.7278/S5d-9xbd-g970 |
| 166 |
 |
2020 | The Utah roadmap: positive solutions on climate and air quality recommendations in brief | DOI 10.7278/S5d-9jv7-g1en |
| 167 |
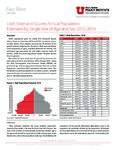 |
2020 | Utah State and County annual population estimates by single year and sex: 2010-2019 | 10.7278/S5d-889w-jwyg |
| 168 |
 |
2019 | Utah State and County annual population estimates by single year of age and sex: 2010-2019 | 10.7278/S5d-pfn4-me10 |
| 169 |
 |
2019 | Utah State and County Annual Population Estimates by Single-Year of Age, Sex, and Race/Ethnicity: 2010-2018 | 10.7278/S5d-xdet-gpag |
| 170 |
 |
2022 | Utah State government growth: following the feds or on its own path? | 10.7278/S5d-n1kc-r8kc |
| 171 |
 |
2023 | Utah strategic energy framework | 10.7278/S5d-0gm7-prpy |
| 172 |
 |
2020 | Utah System of Higher Education: State Aid Project | 10.7278/S5d-t4v6-aek0 |
| 173 |
 |
2020 | Utah Travel and Tourism County profiles, 2018 | 10.7278/S5d-fgqf-zfsn |
| 174 |
 |
| Utah's air & water innovation grant | 10.26052/d-qaqx-j2mh |
| 175 |
 |
2023 | Utah's changing households | 10.7278/S5d-p9fh-skp7 |
| 176 |
 |
2022 | Utah's consumer sentiment continues to Fall in June | 10.7278/S5d-a2ta-xbyw |
| 177 |
 |
2023 | Utah's consumer sentiment drops in February | 10.7278/S5d-k26f-bdw7 |
| 178 |
 |
2022 | Utah's consumer sentiment falls in July | 10.7278/S5d-pg5f-4ncx |
| 179 |
 |
| Utah's consumer sentiment falls in May | 10.7278/S5d-zr4b-5b6e |
| 180 |
 |
2022 | Utah's consumer sentiment falls in November | 10.7278/S5d-jfj6-mjpc |
| 181 |
 |
2022 | Utah's consumer sentiment falls in September | 10.7278/S5d-mp8n-v89v |
| 182 |
 |
2022 | Utah's consumer sentiment falls sharply in March | 10.7278/S5d-4d8r-pjz3 |
| 183 |
 |
2023 | Utah's consumer sentiment fell in August | 10.7278/S5d-af66-gxpb |
| 184 |
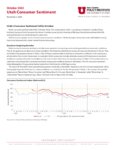 |
2023 | Utah's consumer sentiment fell in October | 10.7278/S5d-9dg5-2xmn |
| 185 |
 |
2022 | Utah's consumer sentiment increases in August | 10.7278/S5d-262z-x67n |
| 186 |
 |
2022 | Utah's consumer sentiment rebounds in April | 10.7278/S5d-zap2-j6p0 |
| 187 |
 |
2022 | Utah's consumer sentiment rises in December | 10.7278/S5d-yv77-q5dv |
| 188 |
 |
2023 | Utah's consumer sentiment rises in January | 10.7278/S5d-ew13-ydwp |
| 189 |
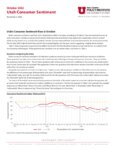 |
2022 | Utah's consumer sentiment rises in October | 10.7278/S5d-zfnv-rqrs |
| 190 |
 |
2023 | Utah's consumer sentiment rose in December | 10.7278/S5d-1ab0-v6kq |
| 191 |
 |
2024 | Utah's consumer sentiment rose in January | 10.7278/S5d-t0hp-0gk7 |
| 192 |
 |
2023 | Utah's consumer sentiment rose in June | 10.7278/S5d-n75c-ftc7 |
| 193 |
 |
2023 | Utah's consumer sentiment rose in November | 10.7278/S5d-x47t-jfv1 |
| 194 |
 |
2023 | Utah's consumer sentiment rose in September | 10.7278/S5d-jpxp-ap75 |
| 195 |
 |
2022 | Utah's consumer sentiment rose slightly in January | 10.7278/S5d-hf3y-b9h0 |
| 196 |
 |
2023 | Utah's consumer sentiment rose slightly in July | DOI 10.7278/S5d-5dtb-7k34 |
| 197 |
 |
2022 | Utah's consumer sentiment shows another modest increase | 10.7278/S5d-vg78-4frt |
| 198 |
 |
2023 | Utah's consumer sentiment steady in March | 10.7278/S5d-ktbt-2qtr |
| 199 |
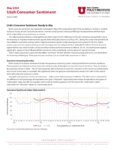 |
2023 | Utah's consumer sentiment steady in May | 10.7278/S5d-7cc3-gb21 |
| 200 |
 |
2023 | Utah's County-to-County migration profiles | 10.7278/S5d-th8e-0x10 |