Over 70,000 photos covering a variety of topics from Marriott Library Special Collections
TO
Filters: Format: "image/jpeg" Collection: "uum_map" Spatial Coverage: "Salt Lake City, Salt Lake County, Utah, United States"
| Title | Collection Number And Name | Photo Number | ||
|---|---|---|---|---|
| 301 |
 |
Photograph of round coin-like object with three symbols [04] | P0466 David J. Buerger photograph collection, circa 1970-1990 | P0466n01_04_019 |
| 302 |
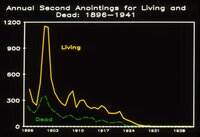 |
Graph titled Annual Second Annointings for Living and Dead: 1896-1941 | P0466 David J. Buerger photograph collection, circa 1970-1990 | P0466n01_04_020 |
| 303 |
 |
Graph titled Cumulative Totals of Temple Ordinances | P0466 David J. Buerger photograph collection, circa 1970-1990 | P0466n01_04_021 |
| 304 |
 |
Graph titled Avg. members vs. Avg. Vicarious Endowments: 1846-1985 | P0466 David J. Buerger photograph collection, circa 1970-1990 | P0466n01_04_022 |
| 305 |
 |
Graph titled Total Members vs. Vicarious Endowments 1971-1985 | P0466 David J. Buerger photograph collection, circa 1970-1990 | P0466n01_04_023 |
| 306 |
 |
Graph titled Convert Baptisms vs. Live Endowments 1971-1985 | P0466 David J. Buerger photograph collection, circa 1970-1990 | P0466n01_04_024 |
| 307 |
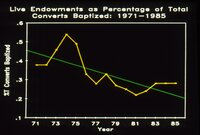 |
Graph titled Live Endowments as Percentage of Total Converts Baptized 1971-1985 | P0466 David J. Buerger photograph collection, circa 1970-1990 | P0466n01_04_025 |
| 308 |
 |
Graph titled Avg. Net Member Increase vs. Avg. Live Endowments 1846-1985 | P0466 David J. Buerger photograph collection, circa 1970-1990 | P0466n01_04_026 |
| 309 |
 |
Graph titled Avg. Live Endowments as Percentage of Avg. Net Member Increase 1846-1985 | P0466 David J. Buerger photograph collection, circa 1970-1990 | P0466n01_04_027 |
| 310 |
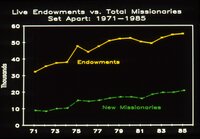 |
Graph titled Live Endowments vs. Total Missionaries Set Apart 1971-1985 | P0466 David J. Buerger photograph collection, circa 1970-1990 | P0466n01_04_028 |
| 311 |
 |
Graph titled Avg. Vicarious Endowments per Member per Year 1846-1985 | P0466 David J. Buerger photograph collection, circa 1970-1990 | P0466n01_04_029 |
| 312 |
 |
Graph titled Vicarious Endowments per Member per Year 1971-1985 | P0466 David J. Buerger photograph collection, circa 1970-1990 | P0466n01_04_030 |
| 313 |
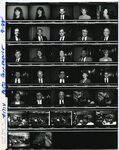 |
Contact sheet of individual and group photos from Taxpayers for Utah press conference | P0484 Taxpayers for Utah photograph collection | P0484n01_01_001 |
| 314 |
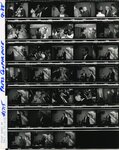 |
Contact sheet of individual and group photos from Taxpayers for Utah press conference | P0484 Taxpayers for Utah photograph collection | P0484n01_01_002 |
| 315 |
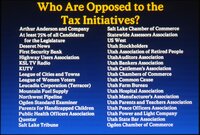 |
Who are opposed to the tax initiatives? | P0484 Taxpayers for Utah photograph collection | P0484n01_01_003 |
| 316 |
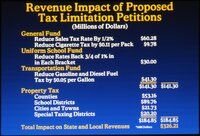 |
Revenue impact of proposed tax limitation petitions | P0484 Taxpayers for Utah photograph collection | P0484n01_01_004 |
| 317 |
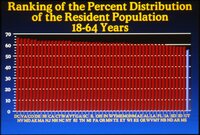 |
Ranking of the percent distribution of the resident population 18-64 years | P0484 Taxpayers for Utah photograph collection | P0484n01_01_005 |
| 318 |
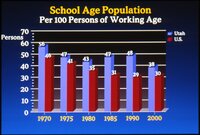 |
School age population per 100 persons of working age 1970-2000 | P0484 Taxpayers for Utah photograph collection | P0484n01_01_006 |
| 319 |
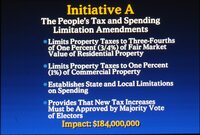 |
Initiative A | P0484 Taxpayers for Utah photograph collection | P0484n01_01_007 |
| 320 |
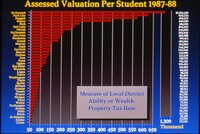 |
Assessed valuation per student | P0484 Taxpayers for Utah photograph collection | P0484n01_01_008 |
| 321 |
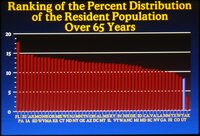 |
Ranking of the percent distribution of the resident population over 65 years | P0484 Taxpayers for Utah photograph collection | P0484n01_01_009 |
| 322 |
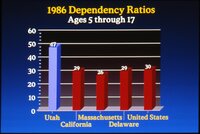 |
1986 dependency ratios | P0484 Taxpayers for Utah photograph collection | P0484n01_01_010 |
| 323 |
 |
Property taxes charged in Utah | P0484 Taxpayers for Utah photograph collection | P0484n01_01_011 |
| 324 |
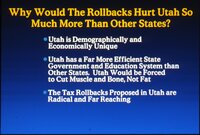 |
Why would the rollbacks hurt Utah so much more than other states? | P0484 Taxpayers for Utah photograph collection | P0484n01_01_012 |
| 325 |
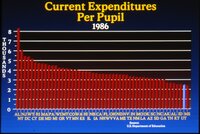 |
Current expenditures per pupil | P0484 Taxpayers for Utah photograph collection | P0484n01_01_013 |