Home
Browse
Ask Us
Chat
Harmful Language Statement
Log in
Photo Archives
Advanced Search
About
Over 70,000 photos covering a variety of topics from Marriott Library Special Collections
Year
1986
1987
1988
TO
1986
1987
1988
Type
Image/StillImage
42
Format
image/jpeg
42
Collection
Photo Archives
42
Filters:
Collection Name:
"Taxpayers for Utah photograph collection"
Format:
"image/jpeg"
Type:
"Image/StillImage"
26
-
50
of
42
<
1
2
>
Gallery view
Number of results to display per page
10
25
50
100
200
Sort by Relevance
Sort by Title A-Z
Sort by Title Z-A
Sort by Date Ascending
Sort by Date Descending
Sort by Last Modified Ascending
Sort by Last Modified Descending
Title
Date
Type
26
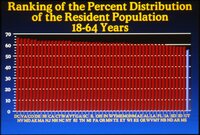
Ranking of the percent distribution of the resident population 18-64 years
1986; 1987; 1988
Image/StillImage
27
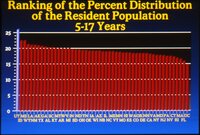
Ranking of the percent distribution of the resident population 5-17 years
1986; 1987; 1988
Image/StillImage
28
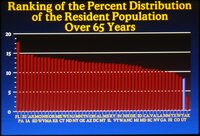
Ranking of the percent distribution of the resident population over 65 years
1986; 1987; 1988
Image/StillImage
29
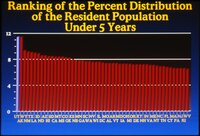
Ranking of the percent distribution of the resident population under 5 years
1986; 1987; 1988
Image/StillImage
30
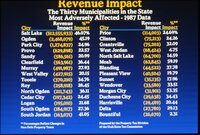
Revenue Impact
1986; 1987; 1988
Image/StillImage
31
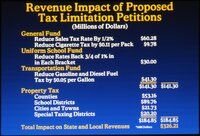
Revenue impact of proposed tax limitation petitions
1986; 1987; 1988
Image/StillImage
32
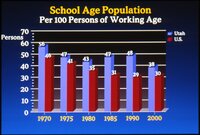
School age population per 100 persons of working age 1970-2000
1986; 1987; 1988
Image/StillImage
33
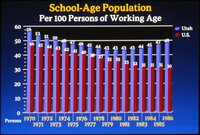
School-age population 1970-1986
1986; 1987; 1988
Image/StillImage
34
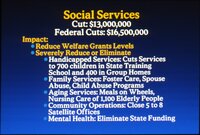
Social services
1986; 1987; 1988
Image/StillImage
35
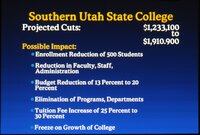
Southern Utah State College
1986; 1987; 1988
Image/StillImage
36
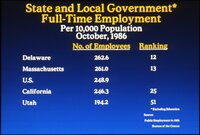
State and local government full-time employment
1986; 1987; 1988
Image/StillImage
37
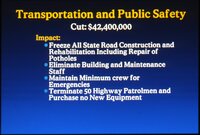
Transportation and public safety
1986; 1987; 1988
Image/StillImage
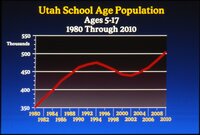
38
Utah school age population
1986; 1987; 1988
Image/StillImage
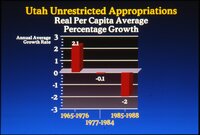
39
Utah unrestricted appropriations
1986; 1987; 1988
Image/StillImage
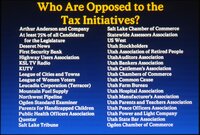
40
Who are opposed to the tax initiatives?
1986; 1987; 1988
Image/StillImage
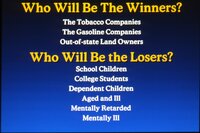
41
Who will be the winners?
1986; 1987; 1988
Image/StillImage
42
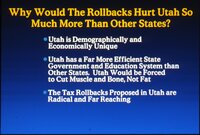
Why would the rollbacks hurt Utah so much more than other states?
1986; 1987; 1988
Image/StillImage
26
-
50
of
42
<
1
2
>