Home
Browse
Ask Us
Chat
Harmful Language Statement
Log in
Photo Archives
Advanced Search
About
Over 70,000 photos covering a variety of topics from Marriott Library Special Collections
Year
1986
1987
1988
TO
1986
1987
1988
Type
Image/StillImage
42
Format
image/jpeg
42
Collection
Photo Archives
42
Filters:
Collection Name:
"Taxpayers for Utah photograph collection"
Format:
"image/jpeg"
Type:
"Image/StillImage"
1
-
25
of
42
<
1
2
>
Gallery view
Number of results to display per page
10
25
50
100
200
Sort by Relevance
Sort by Title A-Z
Sort by Title Z-A
Sort by Date Ascending
Sort by Date Descending
Sort by Last Modified Ascending
Sort by Last Modified Descending
Title
Date
Type
1
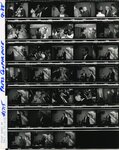
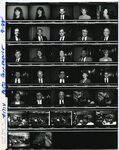
Contact sheet of individual and group photos from Taxpayers for Utah press conference
1988-09
Image/StillImage
2
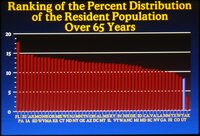
Ranking of the percent distribution of the resident population over 65 years
1986; 1987; 1988
Image/StillImage
3
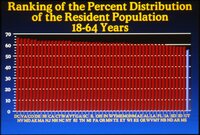
Ranking of the percent distribution of the resident population 18-64 years
1986; 1987; 1988
Image/StillImage
4
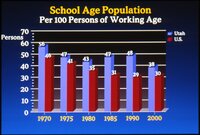
School age population per 100 persons of working age 1970-2000
1986; 1987; 1988
Image/StillImage
5
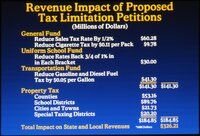
Revenue impact of proposed tax limitation petitions
1986; 1987; 1988
Image/StillImage
6
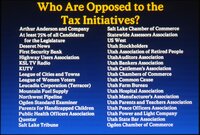
Who are opposed to the tax initiatives?
1986; 1987; 1988
Image/StillImage
7
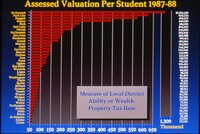
Assessed valuation per student
1986; 1987; 1988
Image/StillImage
8
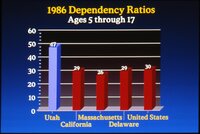
1986 dependency ratios
1986; 1987; 1988
Image/StillImage
9
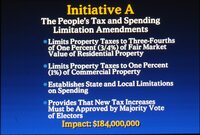
Initiative A
1986; 1987; 1988
Image/StillImage
10
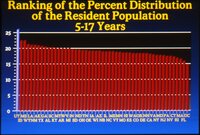
Ranking of the percent distribution of the resident population 5-17 years
1986; 1987; 1988
Image/StillImage
11
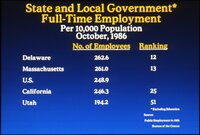
State and local government full-time employment
1986; 1987; 1988
Image/StillImage
12
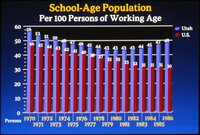
School-age population 1970-1986
1986; 1987; 1988
Image/StillImage
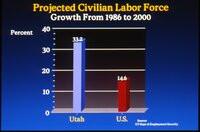
13
Projected civilian labor force
1986; 1987; 1988
Image/StillImage
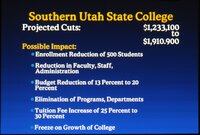
14
Southern Utah State College
1986; 1987; 1988
Image/StillImage
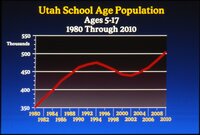
15
Utah school age population
1986; 1987; 1988
Image/StillImage
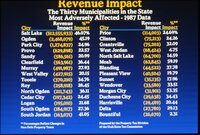
16
Revenue Impact
1986; 1987; 1988
Image/StillImage
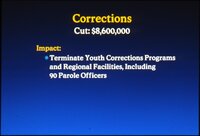
17
Corrections
1986; 1987; 1988
Image/StillImage
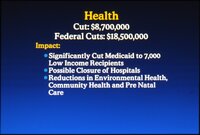
18
Health
1986; 1987; 1988
Image/StillImage
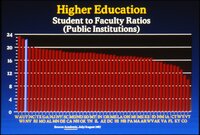
19
Higher education student to faculty ratios
1986; 1987; 1988
Image/StillImage
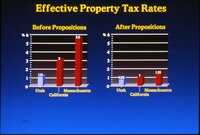
20
Effective property tax rates
1986; 1987; 1988
Image/StillImage
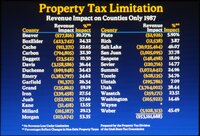
21
Property tax limitation
1986; 1987; 1988
Image/StillImage
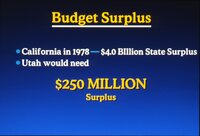
22
Budget surplus
1986; 1987; 1988
Image/StillImage
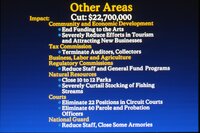
23
Other areas
1986; 1987; 1988
Image/StillImage
24
Contact sheet of individual and group photos from Taxpayers for Utah press conference
1988-09
Image/StillImage
25
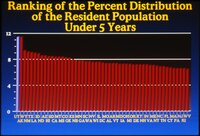
Ranking of the percent distribution of the resident population under 5 years
1986; 1987; 1988
Image/StillImage
1
-
25
of
42
<
1
2
>