| OCR Text |
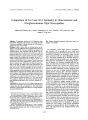
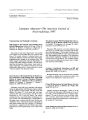
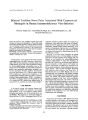
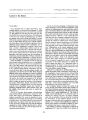
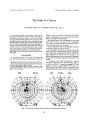
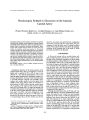
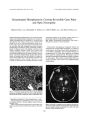
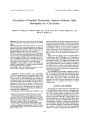
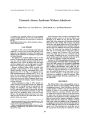
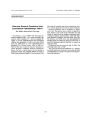
Show Journal of Neuro- Ophthalmology 19( 2): 100- 108, 1999. © 1999 Lippincott Williams & Wilkins, Inc., Philadelphia Comparison of 24- 2 and 30- 2 Perimetry in Glaucomatous and Nonglaucomatous Optic Neuropathies Johnny M. Khoury, M. D., Sean P. Donahue, M. D., Ph. D., Patrick J. M. Lavin, M. D., and James C. Tsai, M. D. Objective: To determine whether the 24- 2 Humphrey visual field ( HVF) ( Humphrey, San Leandro, CA) strategy provides information comparable to that provided by the 30- 2 strategy in patients with optic nerve disease. Methods: In part A of the study, an occluder device was designed to cover the additional outer 22 points tested in the 30- 2 strategy of 187 HVFs from neuro- ophthalmology patients with nonglaucomatous optic neuropathy and 206 HVFs from patients with glaucoma. This device converted the gray scale and probability plots of the 30- 2 HVF to a 24- 2 field. Fields were initially read using the occluder and then were read in a masked manner without the occluder and compared. In part B, 15 healthy volunteers performed both 30- 2 and 24- 2 HVFs. Testing time and global indices were compared. Ninety- five percent of the fields in the neuro- ophthalmology patients, 96% of the fields in patients under observation for suspected glaucoma, 98% of the fields in patients with ocular hypertension, and 100% of the fields in patients with glaucoma were read similarly with the 24- 2 and 30- 2 strategies. In the few cases in which a discrepancy was noted between the 24- 2 and the 30- 2 fields, appropriate clinical management would not have been compromised by using the 24- 2 strategy. Most of these cases were in patients with idiopathic intracranial hypertension and very subtle nerve fiber bundle defects. The 24- 2 strategy had a significantly lower pattern standard deviation ( P < 0.01) and corrected pattern standard deviation ( P = 0.05) than did the 30- 2 strategy. In addition, the 24- 2 strategy shortened the standard threshold testing time by 28% in normal volunteers ( P < 0.0001). Conclusions: In most cases, the 24- 2 testing strategy provides information comparable to that provided by the 30- 2 strategy in a shorter time and with less variability. A 30- 2 HVF may be warranted in patients under observation for evolving idiopathic intracranial hypertension. Manuscript received December 7, 1998; accepted February 10, 1999. From the Departments of Ophthalmology ( J. M. K, S. P. D., P. J. M. L., J. C. T.), Neurology ( S. P. D., P. J. M. L.), and Pediatrics ( S. P. D.), Vander-bilt University School of Medicine, Nashville, Tennessee, U. S. A. Presented in part at the North American Neuro- Ophthalmology Society meeting, Keystone, Colorado, February 1997, and in poster form at the Association for Research in Vision and Ophthalmology meeting, Ft. Lauderdale, Florida, April, 1997. Address correspondence and reprint requests to Sean P. Donahue, M. D., Ph. D., Assistant Professor of Ophthalmology, 1215 21st Avenue South, Vanderbilt Medical Center East, 8th Floor, Nashville, TN 37232- 8808, U. S. A. Key Words: Automated perimetry- Glaucoma- Optic neuropathy- Visual field. The Humphrey Visual Field Analyzer ( Humphrey, San Leandro, CA) is probably the most widely used automated perimeter in the United States. However, high variability in threshold and prolonged testing time are major problems with the current Humphrey strategy ( 1,2). Test- retest variability in the diseased visual system is greater than that in healthy eyes, often leading to difficulties and uncertainties in determining progression of disease ( 3,4). Because clinicians and their patients have both been frustrated by the duration of the standard threshold test, various time- saving options have been suggested, but these have resulted in even greater variability. FASTPAC provides significant time reduction at the cost of higher threshold fluctuation, greater intratest variance, and a decreased estimate of field defect severity ( 5,6). This may lead to problems in detecting relative defects or progression of disease. The 52- point suprathreshold screening test saves even more testing time but is not a clinically acceptable alternative because of a significant decrease in reliability ( 7). The 24- 2 program is another strategy available for testing visual fields. The HVF 24- 2 program tests a grid of 52 points that cover the central 24°, and the two points located at 27° nasally ( Fig. 1). In contrast, the 30- 2 HVF program tests a grid of 76 points over the central 30° of the visual field. Because the 24- 2 tests fewer points than the 30- 2, the testing time with the 24- 2 is less. In addition, because perimetric sensitivity decreases with test duration and with increasing stimulus eccentricity ( 8- 11), we hypothesized that variability should be less with the 24- 2 program. However, a potential concern with the 24- 2 strategy was that clinically important information might be sacrificed, because the midperiphery is not tested. We evaluated both test strategies to determine whether the 24- 2 strategy could provide information comparable to that provided by the 30- 2 strategy in patients with glaucomatous and nonglaucomatous optic neuropathies. 100 30- 2 VERSUS' 24- 2- yJSUAL FIELDS 101 RIGHT EYE TABLE 1. Number of fields studied per patient diagnosis ".• Jr.'*"' » ,:\ Wv* » ' . -. . TEMPORAL FIG. 1. The 24- 2 strategy includes all 52 points within the central 24°, plus two points along the nasal horizontal ( black circles). The 30- 2 strategy includes an additional 22 points ( empty squares). METHODS The study consisted of two parts. In part A the 24- 2 portion of 30- 2 fields was evaluated. To determine whether critical diagnostic information was sacrificed when the 24- 2 strategy was used, we analyzed 187 30- 2 fields from neuro- ophthalmology patients with non-glaucomatous optic neuropathy and 206 30- 2 fields from patients with glaucoma. The neuro- ophthalmologic fields represented all visual fields from patients seen by one of us in the Neuro- ophthalmology Clinic at Vander-bilt Medical Center ( Nashville, Tennessee) over 5 years, and the glaucoma fields represented all patients with patients seen by J. C. T. in the Glaucoma Clinic over 4 months. Investigational Review Board approval was obtained for chart reviews of visual fields. The patients had a wide variety of types of optic neuropathy ( Table 1) and varying degrees of visual field loss ( Table 2). We considered fields with a mean deviation of less than - 5.00 dB to represent mild visual loss, fields with a mean deviation between - 5.01 and - 15.00 dB to represent moderate visual loss, and fields with a mean deviation of more than - 15.01 dB to represent severe visual loss. We constructed an opaque occluder device to place Patient diagnosis Glaucoma Glaucoma suspect Ocular hypertension Idiopathic intracranial hypertension Pituitary tumor/ chiasmal syndrome Optic nerve glioma Seizure disorder Demyelinating optic neuropathy Grave ophthalmopathy Optic nerve sheath meningioma Anterior ischemic optic neuropathy Stroke Optic nerve drusen Anomalous optic discs Monocular diplopia/ refractive error Dominant optic neuropathy of Kjer No. of fields 76 67 63 59 49 14 13 12 12 9 5 4 4 2 2 2 over the 30- 2 printout and cover the 22 peripheral points tested solely by the 30- 2 strategy ( Fig. 2). This converted the gray scale and probability plots from a 30- 2 to a 24- 2 field. To consider a field abnormal, we required three adjacent points at P < 0.05, or two adjacent points at P < 0.01 in the pattern deviation plots to be abnormal. Each field was initially read as 24- 2 using the occluder, then read as 30- 2 in a masked manner. All fields were read by two investigators ( J. M. K., S. P. D.). Fields were described and grouped into one of 10 categories ( Table 3). If the two readers disagreed on the type of field defect, one of the remaining two investigators was consulted. For each of the 393 fields, we determined whether the field defects were similar or different when read with and without the opaque occluder. In part B, a prospective comparison of testing time and global indices in healthy volunteers was performed. To compare directly the 24- 2 and the 30- 2 strategies, we asked 15 volunteers to take the 24- 2 and the 30- 2 tests using their dominant eyes. Investigational Review Board approval was obtained. All volunteers had normal findings in eye examinations ( except for refractive error, which was corrected during the visual field examination), and all were familiar with the HVF test. The test performed first was randomly determined. We then compared the testing time and the global indices between the two strategies ( two- tailed paired Mest). TABLE 2. Amount of visual field loss per patient diagnosis Glaucoma patients Glaucoma suspect patients Ocular hypertension patients Neuro- ophthalmology patients No. of fields with mild visual loss ( MD <- 5.00) 21 60 61 132 No. of fields with moderate visual loss ( MD between - 5.01 to - 15.00) 23 7 2 46 No. of fields with severe visual loss MD >- 15.01 32 - - 9 MD, mean deviation. J Neuro- Ophthalmol, Vol. 19, No. 2, 1999 102 J. M. KHOURYETAL. 3 rlX- r*^ ^ ^ M TJUKJ. i! Bg. L - ^ g ^ f FIG. 2. Photograph of a translucent occluder on top of a normal left 30- 2 Humphrey ( San Leandro, CA) visual field. The photograph is deliberately underexposed to demonstrate the occluder. The portions of the gray scale and the outer 22 points on the probability plots that correspond only to the 30- 2 program are covered by the occluder. In practice, the occluder was opaque; a translucent one is used here for demonstration. RESULTS Part A: Direct Comparison of 187 Neuro- ophthalmologic Fields For each field, we determined the nature of the field defect present on the 30- 2 printout. Independently and in a masked manner, we determined the field defect present when the peripheral 22 points were covered ( the 24- 2 field). Fields were classified into 10 categories ( Table 3). The results are summarized in Table 4. One hundred seventy- seven ( 95%) of the 187 neuro- ophthalmologic TABLE 3. Field classification Normal Nerve fiber bundle defect Hemifield/ quadrant defect Altitudinal defect Scattered/ full- field depression Enlarged blind spot Central/ cecocentral scotoma Generalized field constriction Unreliable/ psychogenic field Lens rim artifact fields were interpreted identically with both the 24- 2 and 30- 2 strategies. Ten ( 5%) fields were interpreted differently. These 10 fields could be classified into two groups: those in whom the 30- 2 results were artifactually abnormal, and those in whom the 24- 2 results were falsely normal. Two fields were normal in 24- 2 testing, but they showed a rim artifact on 30- 2 testing ( Fig. 3). TABLE 4. Direct comparison of the 187 neuro- ophthalmology fields Field classification Normal Nerve fiber bundle Hemifield/ quadrant Scattered/ full- field depression Constricted field Altitudinal Enlarged blind spot/ cecocentral Unrealiable/ cloverleaf Mismatch" " 2 fields normal on 24- 4, rim artifact on 30- 2. 7 fields normal on 24- 2, early nerve fiber bundle defect on 30- 2. 1 field normal on 24- 4, small hemifield defect on 30- 2. No. of fields (%) 66 ( 35) 31 ( 16.5) 30( 16) 30( 16) 7( 4) 5 ( 2.5) 5 ( 2.5) 3 ( 1.5) 10( 5) J Neuro- Ophthalmol, Vol. 19, No. 2, 1999 30- 2 VERSUS 24- 2 VISUAL FIELDS 103 .....^^^^ ES^ i::^ - : - . ' . X " . > . ' . : - . " . > . ' . > . : : : : : : : : : : : : : : : : : Wy. v.:-.":-.; XZ& Z..\::-.-.-.- row. revm ™ * a » & « ?.! « g PMBOBttm sums ••• f< R 8P< i* Kp< e. K » FIG. 3. Photograph of a rim artifact seen on the 30- 2 printout ( A), but not when the opaque occluder covered the outer peripheral points, and produced a 24- 2 field ( B). £ » Seven fields with an early nerve fiber bundle defect ( according to our stringent criteria for abnormality; see Methods) detected in the 30- 2 test appeared normal in the 24- 2 test ( Fig. 4). All were in patients with recently diagnosed idiopathic intracranial hypertension. One field appeared normal in the 24- 2 strategy but had a small hemifield defect in the 30- 2 test ( Fig. 5). This occurred in a patient with resolving homonymous quadranopsia after temporal lobectomy ( see Discussion). Part A: Direct Comparison of the 206 Glaucoma Fields All 76 fields in patients with glaucoma were interpreted similarly with both strategies. Most fields had mild to severe nerve fiber bundle defects ( arcuate scotomas, nasal steps) or constricted fields. Among the 67 fields in patients under observation for suspected glaucoma, 64 ( 96%) had similar interpretations with the 30- 2 and the 24- 2 strategies ( Table 5). One normal 24- 2 field J Neuro- Ophthalmol, Vol. 19. No. 2, 1999 104 J. M. KHOURYETAL. TOTAL DEVIATION ff. • & PROBflBIUTY SYIHILS - P < K HS. fi V. » f < P. « tP< 8.5X PATTERN DEVI8T10H • :: - • • ' : : • - :: :: » : - > « ^ j === FIG. 4. A: Photograph of an early inferona-sal nerve fiber bundle defect seen on the total and pattern deviation of the 30- 2 printout in this patient with idiopathic intracranial hypertension. B: The 24- 2 printout using the occluder normalizes the pattern deviation plot, but the defect is still present on the total deviation plot. : v>.:-.":-.":& » ' - I T had a lens rim artifact on 30- 2. Two ( 3%) fields showing early and very subtle nerve fiber bundle defects on 30- 2 appeared normal on 24- 2 ( Fig. 6). Both 30- 2 fields had three adjacent abnormal points at P < 0.05 in the pattern deviation plot. Of the 63 fields in patients with ocular hypertension, 62 ( 98%) fields were read similarly with both strategies ( Table 6). One normal 24- 2 field had a lens rim artifact on 30- 2. Part B: Testing Time and Global Indices in Healthy Volunteers The results of paired testing of 15 healthy volunteers on the testing time and global indices are shown in Table 7. Healthy volunteers took 28% longer to take the 30- 2 test than the 24- 2 test ( P < 0.0001). Among the global indices, both the pattern standard deviation ( PSD) and the corrected pattern standard deviation J Neuro- Ophthalmol, Vol. 19, No. 2, 1999 30- 2 VERSUS 24- 2 VISUAL FIELDS 105 £;*•-":::::::::::::: 360i"'""" T'jiTi'"'"•'•"•'' : : : : : : : : : : : : :>$ 2: . - . : : - H 1- TOfflL DFVIfiTIOM 52 *? J IHIICKK OEVIflllW •••• « PROSBttlTY SVtBOtS := P< 5! « P < 2X » P < R HP< 8. R KJf.:-.:::::::. :::::::::.-^:.-.: FIG. 5. A: Photograph of a superior small hemifield defect on the 30- 2 printout in a patient who had undergone a temporal lobectomy for uncontrollable seizures. B: Had the patient's clinical history, previous fields, and the field from the fellow eye not been known, this defect might have been missed on 24- 2 testing ( see Discussion). " SS5 ( CPSD) were also significantly reduced with the 24- 2 strategy. DISCUSSION Current methods of automated perimetry are complicated by the prolonged testing times and high levels of test- retest variability. Newer automated techniques have improved testing time, yet worsened variability. We hypothesized that the 24- 2 strategy would lessen both testing time and variability without sacrificing clinically important information. In this study, the 24- 2 testing strategy provided clinical information identical with that provided by the 30- 2 strategy in more than 95% of glaucomatous and nonglau-comatous optic neuropathy cases. Of the 10 neuro- J Neuro- Ophthalmol, Vol. 19, No. 2, 1999 106 J. M. KHOURYETAL. TABLE 5. Direct comparison of the 67 glaucoma suspect fields No. of fields (%) Field classification 36 ( 54) 16 ( 24) 12( 18) 3( 4) Normal Nerve fiber bundle Scattered depression or other Mismatch" " 1 field normal on 24- 2, rim artifact on 30- 2. 2 fields normal on 24- 4, early NFB defect on 30- 2. ophthalmologic fields that had a discrepancy between the 24- 2 and 30- 2 strategies, two were lens rim artifacts. Eight of the abnormal ( according to our strict criteria for definition of abnormality, see Methods) 30- 2 fields were considered normal on 24- 2. Seven of these eight fields had early and subtle nerve fiber bundle defects in 30- 2 testing and were in patients with recently diagnosed idiopathic intracranial hypertension ( Fig. 4). In none of these seven patients would appropriate clinical management have been compromised by use of the 24- 2 HVF. m i^ iipH « ^^== * Ty.. i !.. •>..: vi. i;-:'-: i; • .-.•.::*.* Hg&:::::::::: :; v; vrjS:;::;:;:; i TOTd EVtflTIOH OEVKKTIOH FHWBILnY SYMBOLS ::. P< R JtP< tt • p< e. K « ^&£&&& » £&% k !! II1)!!!!!:!:!:!:! K ::{::::[::::: H::::|:? V ' " " * * t't I li*?. !&&• ;• ; : 5 :-".- y.-"."::: 5* S § £>-::::: i -+- FIG. 6. A: Photograph of an early nerve fiber bundle defect seen on the 30- 2 printout in this patient under observation for suspected glaucoma. The field was considered abnormal because of three adjacent points at P< 0.05 probability level in the pattern deviation plot. B: The 24- 2 printout appears normal. J Neuro- Ophthalmol, Vol. 19, No. 2, 7999 30- 2 VERSUS. 24- 2 VISUAL FIELPS 107 The field with a mild hemifield defect on 30- 2 that appeared normal on 24- 2 ( Fig. 5) was from a patient who was recovering from a successful partial right temporal lobectomy for intractable seizures. Immediate postoperative testing demonstrated dense left superior quadranop-sia evident on both 30- 2- and 24- 2- tested fields. The field shown in Figure 5 was tested 4 months after surgery with two interim fields showing improvement of the quadranopsia. Although the 24- 2- tested field of this patient's right eye was normal when read in isolation, when combined with the previous fields, the field from the left eye, the patient's history, and confrontation field testing, the defect would have been easily suspected. Nevertheless, it may be necessary to consider testing the peripheral superior vertical either with the 30- 2 program or with a modified 24- 2 program in selected patients at high risk for early defects ( e. g., patients with suprasellar tumors). Fields in patients with glaucomatous optic neuropathy and those in patients observed for ocular hypertension had similar findings with both strategies. In patients under observation for suspected glaucoma, two ( 3%) fields were read as normal on 24- 2 but had early nerve fiber bundle defects detected on 30- 2. Both 30- 2- tested fields were considered abnormal because they had three abnormal adjacent points at P < 0.05 ( Fig. 6). No points were depressed to more than the 0.05 level, and many glaucoma specialists might have read these fields as normal, because of the subtle nature of the abnormal points. Overall, 14 ( 3.5%) of 393 fields were read differently using both strategies. Of the 14 mismatched fields, 4 ( 28%) were due to a rim artifact. Thus, the false- normal rate was only 10 ( 2.5%) of 393 fields. In part B of our study, 30- 2- tested fields from healthy volunteers showed significantly higher PSD and CPSD than did 24- 2- tested fields, indicating higher variability in the 30- 2 test results. The PSD is a measure of the standard deviation of the points in the pattern- deviation determination. It is an indication of how much each point differs from adjacent points. A higher PSD indicates increased variability among neighboring points. Because it is difficult to assign much weight to this comparison when marked variability occurs on repeated testing of the same point ( i. e., high short- term fluctuation), the CPSD was introduced as a measure of PSD corrected for the short- term fluctuation. Variability as measured both by the PSD, and the CPSD was lessened significantly when the 24- 2 strategy was used. Because these results were obtained in normal volun- TABLE 6. Direct comparison of the 63 ocular hypertension fields No. of fields (%) Field classification 41 ( 65) Normal 14 ( 22) Scattered depression or other 7( 11) Nerve fiber bundle 1 ( 1.5) Mismatch" " 1 field normal on 24- 2, rim artifact on 30- 2. TABLE 7. Comparison of global indices and test time in healthy volunteers 24- 2 30- 2 p MD ( av ± sd) - 2.02 ± 1.71 - 1.92 ± 1.84 NS PSD ( av ± sd) 1.78 ± 0.35 2.12 ± 0.55 < 0.01 SF ( av ± sd) 1.50 ± 0.46 1.43 ± 0.33 NS CPSD ( av ± sd) 0.66 ± 0.60 1.18 ± 0.84 0.05 Time ( mimsec): av± sd 10: 24 ± 1: 11 14: 25 ± 1: 33 p< 0.0001 range 8: 24- 12: 27 12: 20- 16: 55 MD, mean defect; PSD, pattern standard deviation; SF, short- term fluctuation; CPSD, corrected pattern standard deviation; av, average; sd, standard deviation. Values are mean ± standard deviation. teers and the diseased visual system has much higher variability in testing, it is likely that the relative improvement in variability with the 24- 2 field strategy would be even more pronounced in patients who have optic neuropathy. The 24- 2 shortens the standard 30- 2 threshold test by approximately 30%. Shortening the test should increase patient comfort and improve the patient's attention span, resulting in less variability. Results in several studies have shown that variability in threshold increases with increasing testing time and that patient fatigue causes a loss in accuracy and reproducibility of testing ( 6,11- 13). Finally, because learning effects ( improvement in field with repeated testing) are more pronounced in the periphery of the field ( 12), the 24- 2 program should theoretically require fewer repeat fields to produce an adequate baseline for clinical follow- up than would the 30- 2 program. In summary, in most cases, the 24- 2 strategy provides comparable information to the 30- 2 strategy in a shorter time and with less variability. It can be substituted for the standard 30- 2 program without compromising patient care in both outpatient neuro- ophthalmology and glaucoma clinics. Particular attention should be paid to the 24- 2 visual fields obtained in patients recently diagnosed with and in those under observation for idiopathic intracranial hypertension. In these cases, 30- 2 HVF may be warranted. It should be noted that the 24- 2 HVF does not replace confrontation visual field testing, tangent screen testing, or Goldmann kinetic perimetry when these tests are clinically indicated and that all clinical tests of afferent visual system function should be interpreted in the context of the patient's clinical history and physical findings. Some disorders, such as retinitis pigmentosa syndromes, and anterior occipital cortical lesions ( temporal crescent syndrome) cannot be tested appropriately with either the 24- 2 or the 30- 2 program. Standard kinetic ( Goldmann) perimetry or confrontation techniques are indicated in these patients. Acknowledgment: Dr. Donahue is the recipient of a career development award from Research to Prevent Blindness, New York, New York. J Neuro- Ophthalmol, Vol. 19, No. 2, 1999 108 J. M. KHOURYETAL. REFERENCES 1. Parrish RK, Schiffman J, Anderson DR. Static and kinetic visual field testing. Reproducibility in normal volunteers. Arch Ophthalmol 1984; 102: 1497- 502. 2. Heijl A, Lindgren G, Olsson J. Normal variability of static perimetric threshold values across the central visual field. Arch Ophthalmol 1987; 105: 1544- 9. 3. Heijl A, Lindgren A, Lindgren G. Test- retest variability in glaucomatous visual fields. Am J Ophthalmol 1989; 108: 130- 5. 4. Haefliger IO, Flammer J. Fluctuation of the differential light threshold at the border of absolute scotomas. Comparison between glaucomatous visual field defects and blind spots. Ophthalmology 1991; 98: 1529- 32. 5. Schaumberger M, Schafer B, Lachenmayr BJ. Glaucomatous Field Fields. FASTPAC versus full threshold strategy of the Humphrey Field Analyzer. Invest Ophthalmol Vis Sci 1995; 36: 1390- 7. 6. Flanagan JG, Wild JM, Trope GE. Evaluation of FASTPAC, a new strategy for threshold estimation with the Humphrey Field Analyzer, in a glaucomatous population. Ophthalmology 100: 949- 54. 7. Mills RP, Barnebey HW, Migliazzo CV, Li Y. Does saving time using FASTPAC or suprathreshold testing reduce quality of visual fields? Ophthalmology 1994; 101: 1596- 603. 8. Searle AET, Wild JM, Shaw DE, O'Neill EC. Time- related variation in normal automated static perimetry. Ophthalmology 1991; 98: 701- 7. 9. Heijl A, Drance SM. Changes in differential threshold in patients with glaucoma during prolonged perimetry. Br J Ophthalmol 1983; 67: 512- 6. 10. Johnson CA, Adams CW, Lewis RA. Fatigue effects in automated perimetry. Appl Opt 1988; 27: 1030- 7. 11. Langerhorst CT, Van Den Berg TJTP, Veldman E, Greve EL. Population study of global and local fatigue with prolonged threshold testing in automated perimetry. In: Heijl A, Greve EL, eds. Seventh International Visual Field Symposium. Dordrecht: Marti-nus Nijhoff/ Dr. W. Junk, 1987; 657- 62. 12. Heijl A, Lindgren G, Olsson J. The effect of perimetric experience in normal subjects. Arch Ophthalmol 1989; 107: 81- 6. 13. Hudson C, Wild JM, O'Neill EC. Fatigue effects during a single session of automated static threshold perimetry. Invest Ophthalmol Vis Sci 1994; 35: 268- 80. J Neuro- Ophthalmol, Vol. 19, No. 2, 1999 |