| OCR Text |
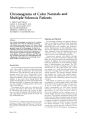
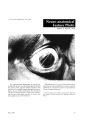
Show ]. Clin. Neuro-ophthalmol. 3: 37-39, 1983. Chromograms of Color Normals and Multiple Sclerosis Patients G. PHILIP MATTHEWS CAROL R. KOLLARITS, M.D. FRANK J. KOLLARITS, Ph.D KATURAH ROBINSON THOMAS J. MEHELAS, M.D. EDUARDO F. CALDERONE, M.D. Abstract The Gunkel chromograph was tested on 81 volunteers with normal color vision as indicated by screening with Ishihara plates and the panel 0-15. Most of these color normals located their neutral area superior to the geometric center of the chromogram. A minority located their neutral area at the geometric center. Recognition of this variation may prevent misdiagnosis of chromographs of patients suspected of having color vision defects. All 29 eyes with history and YEP findings consistent with optic nerve demyelinization had enlargement of the neutral area, even though visual acuity could be corrected to 20/20. Introduction The conventional clinical tests used for detecting color vision defects include pseudoisochromatic plates, the Nagel anomaloscope, the Farnsworth dichotomous color 100 hue test, and the less cumbersome panel D-15 test. I Unfortunately, these tests fail to provide clinical validity for colors a subject can identify or those colors a subject cannot identify. A new color vision testing device, the Gunkel chromograph, has been used to determine the type and extent of congenital color defects and has been utilized in testing patients with known color vision defects.~·:S The purpose of this study was to determine the location and extent of the neutral area perceived by individuals with normal color vision. In addition, we tested 18 patients with multiple sclerosis and a past history of optic neuritis in at least one eye (29 affected eyes). From the Division of Ophth<llmology (CPM, CRK, KR, TIM). DepMtment of Surgery, Medic<ll College of Ohio; the Depdrtmen! of Electric<ll Engineering (FIK). University of Toledo; <lnd the DepMtment of Neurology (He). Mercy Hospit<ll, Toledo, Ohio March 1983 Materials and Methods One hundred volunteers were tested in the Eye Clinic at the Medical College of Ohio during July and August, 1981. Three color vision tests were performed while each volunteer was waiting to receive dilating drops for the ophthalmic examination. The volunteers ranged in ages from 5 to 85 years. Informed consent was obtained from each volunteer or from a parent if the volunteer was a minor. All tests were conducted binocularly. Twenty-seven patients with definite multiple sclerosis were tested monocularly using the same three color vision tests that were used with the 100 normals. In addition, the visual-evoked potential (YEP) was performed on all 27 patients to determine if demyelinization was present. The YEP stimulus was a pattern consisting of checks with a reversal time of 1.88 cycles/second and a check size setting of 16. Scalp electrode placement was CZ (vertex of scalp), OZ (1 em above inion), and earlobe (ground). The distance between patients and stimulus was I meter. One hundred twentyeight sweeps were computed for each wave form; monocular as well as binocular responses were also recorded. Each patient or volunteer was asked to identify the numbers on Ishihara plates under a Mac Beth Easel lamp and to arrange the caps in the panel DIS tray in serial order according to hue. I The Gunkel chromograph was used under subdued illumination. The volunteer was asked to identify the presence of color and to name the colors as they were produced on the viewing screen. A control handle operated by the examiner altered the colors. The examiner initiated the testing in the neutral area and then proceeded toward the colors in the following manner: neutral to green to neutral to magenta to neutral to turquoise to neutral to red to neutral to yellow to neutral to blue. Each time the subject identified a color (whether right or wrong), the examiner pressed a bulb and a point was indented into the chromogram. The points on 37 Color Vision in Multiple Sclerosis the chromogram were connected together. The area within the connected points was considered the neutral area for that volunteer or patient. Results Of 100 volunteers with visual acuity correctable to 20/20, only 81 had both normal fundus examinations and normal color vision screening with the Ishihara plates and the panel 0-15. The chromo- Green A Magenta Green Magenta Figures lA and lB. Neutral area plotted with the Gunkel chromograph for 81 volunteers with 20/20 visual acuity. normal ophthalmoscopic examinations. and normal results on screening with Ishihara plates and the panel D-15 test. (A ) Seventy-two (89%) color normals identified a neutral area superior to the geometric center of the chromogram. (B) Nine (11%) identified the geometric center of the chromogram as neutral. 38 Magenta Figure 2. Mean neutral area for 29 eyes with a past history of optic neuritis from 18 multiple sclerosis patients. All of these eyes had visual acuity correctable to 20/20; their VEPs, however. were consistent with previous demyelinating disease of the optic nerve. 3.5 3.0 2.5 2.0 1.5 1.0 .5 REO MAGENTA BLUE TUROUOtSE GREEN YEllOW Figure 3. Means and standard deviations of the neutral area plotted with the Gunkel chromograph for 29 eyes with optic nerve demyelination from 18 multiple sclerosis patients. Journal of Clinical Neuro-ophthalmology grams of these color normals demonstrated two separate neutral areas. The geometric center of the chromograph was perceived as being neutral by only nine (11%) of the 81 color normals. The remaining 72 (89%) color normals said this area appeared distinctly blue, but could locate a neutral area above the geographic center of the chromograph (Fig. 1). Twenty-nine eyes from 18 patients were diagnosed as having optic neuritis by a past history of visual loss with spontaneous recovery to 20/20 over a period of weeks. In each of the 29 eyes, the YEP implicit times were greater than 120 m second, and the waveforms were distorted. Their chromogram neutral areas were enlarged (Fig. 2). Failure of color perception was greatest for yellow, green, and turquoise and less severe for red, magenta, and blue (Fig. 3). Discussion Our results indicate that volunteers who are color normals (according to screening with Ishihara plates and the panel 0-15 test) may locate a neutral area in the center of the Gunkel chromogram or above the geometric center. Eyes with a previous history of optic neuritis secondary to multiple sclerosis were found to have enlargement of the neutral area of the chromogram, even in the presence of 20/20 vision. In these eyes with 20/20 vision, the March 1983 Matthews, et .11. diagnosis of a previous optic neuritis was confirmed by visual-evoked potential testing. These findings confirm the importance of color vision testing in patients with suspected optic nerve disease. References 1. Fishman, c.: Techniques, merits and limitations of basic tests for color defectiveness. SUN. Ophthdlmol. 15: 370-373, 1971 2. Gunkel, RD., and Cogan, DC.: Colormetry by a new principle. Arch. Ophthdlmol. 96: 331-334,1978. 3. Gunkel, RD.: Congenital color blindness. Arch. Ophthalmol. 99: 1023-1027, 1981. 4. Sloan, LL, and Habel, A.: Tests for color deficiency based on the pseudoisochromatic principle. A comparative study of several new tests. A.M.A. Arch. Ophthalmol 55: 229-239,1956. 5. Farnsworth, D.: The Farnsworth Dichotomous Test for Color Blindness, Panel 0-15. The Munsell Color Co. Inc, Baltimore, 1957. Acknowledgment This project was supported by funds from the Ohio Lions Eye Research Foundation, Columbus, Ohio. Write for reprints to: Carol R. Kollarits, MD., Chief, Division of Ophthalmology, Medical College of Ohio, CS. 10008, Toledo, Ohio 43699. 39 |