| OCR Text |
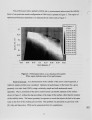
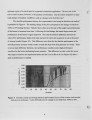
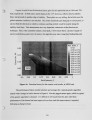
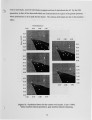
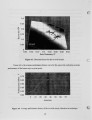
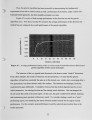
Show Figure A5 shows both the absolute and the average performance histories of a typical application of the genetic algorithm. Note the relatively erratic trace of the absolute performance index as compared to Figure A2. This is due to the genetic algorithm's evaluation of an entire population at once. The genetic algorithm is not concerned with the order in which evaluations are made. It functions, rather,.from the whole population at once, taking all performance values in parallel and generating a new population based on the relative performance of the previous population. Hence, the separation of the genetic algorithm's performance history curve into sections, demarcated by vertical lines in the figure. Although probably of concern in a practical sense, the jagged nature of the absolute performance line is not important to the function of the genetic algorithm. What is important is the average performance, after each entire population. This average performance is shown to increase steadily. 0.75 ~ >< 0.65 Q.) ]... ... 0.55 Q.) (.) ~ 0.45 ~ 0.35 Q.) ~ 0.25 0 5 10 15 20 25 30 35 40 45 50 individual Figure AS. Absolute (black) and average (white) performance history of the co-swirl nozzle, genetic algorthm. White numerals and lines separate generations. Figure A6 is the population history for this same run. This figure is perhaps more illustrative than Figure AS. The first generation is essentially uniform across the search space. In the second generation, it is clear that some less-fit individuals have died off. By the third generation, there is a clear migration toward the region of peak performance and in the fourth generation all but three of the twelve individuals have converged to the same area of high performance. 20 |