| Title | Date | Type | Setname | ||
|---|---|---|---|---|---|
| 51 |
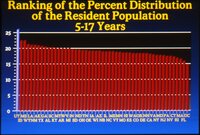 |
Ranking of the percent distribution of the resident population 5-17 years | 1986; 1987; 1988 | Image/StillImage | uum_map |
| 52 |
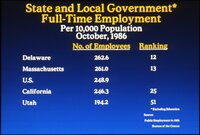 |
State and local government full-time employment | 1986; 1987; 1988 | Image/StillImage | uum_map |
| 53 |
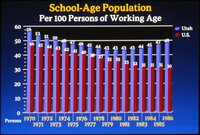 |
School-age population 1970-1986 | 1986; 1987; 1988 | Image/StillImage | uum_map |
| 54 |
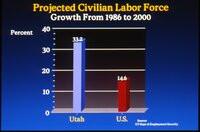 |
Projected civilian labor force | 1986; 1987; 1988 | Image/StillImage | uum_map |
| 55 |
 |
Southern Utah State College | 1986; 1987; 1988 | Image/StillImage | uum_map |
| 56 |
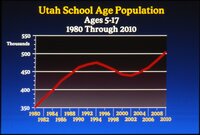 |
Utah school age population | 1986; 1987; 1988 | Image/StillImage | uum_map |
| 57 |
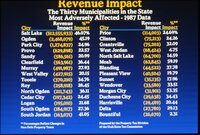 |
Revenue Impact | 1986; 1987; 1988 | Image/StillImage | uum_map |
| 58 |
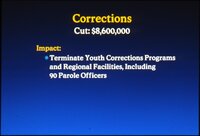 |
Corrections | 1986; 1987; 1988 | Image/StillImage | uum_map |
| 59 |
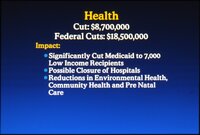 |
Health | 1986; 1987; 1988 | Image/StillImage | uum_map |
| 60 |
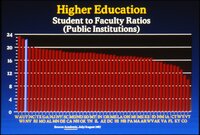 |
Higher education student to faculty ratios | 1986; 1987; 1988 | Image/StillImage | uum_map |
| 61 |
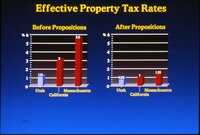 |
Effective property tax rates | 1986; 1987; 1988 | Image/StillImage | uum_map |
| 62 |
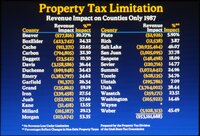 |
Property tax limitation | 1986; 1987; 1988 | Image/StillImage | uum_map |
| 63 |
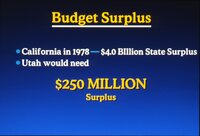 |
Budget surplus | 1986; 1987; 1988 | Image/StillImage | uum_map |
| 64 |
 |
Other areas | 1986; 1987; 1988 | Image/StillImage | uum_map |
| 65 |
 |
Contact sheet of individual and group photos from Taxpayers for Utah press conference | 1988-09 | Image/StillImage | uum_map |
| 66 |
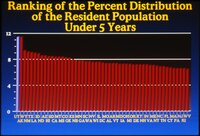 |
Ranking of the percent distribution of the resident population under 5 years | 1986; 1987; 1988 | Image/StillImage | uum_map |
| 67 |
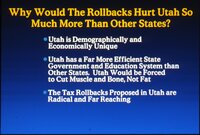 |
Why would the rollbacks hurt Utah so much more than other states? | 1986; 1987; 1988 | Image/StillImage | uum_map |
| 68 |
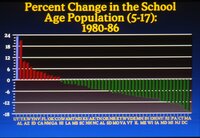 |
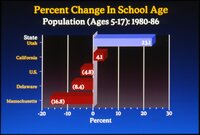
Percent change in the school age population | 1986; 1987; 1988 | Image/StillImage | uum_map |
| 69 |
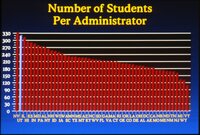 |
Number of students per administrator | 1986; 1987; 1988 | Image/StillImage | uum_map |
| 70 |
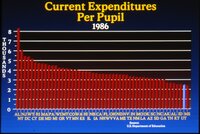 |
Current expenditures per pupil | 1986; 1987; 1988 | Image/StillImage | uum_map |
| 71 |
 |
Property taxes charged in Utah | 1986; 1987; 1988 | Image/StillImage | uum_map |
| 72 |
 |
Percent change in school age | 1986; 1987; 1988 | Image/StillImage | uum_map |
| 73 |
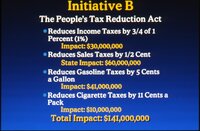 |
Initiative B | 1986; 1987; 1988 | Image/StillImage | uum_map |
| 74 |
 |
Initiative C | 1986; 1987; 1988 | Image/StillImage | uum_map |
| 75 |
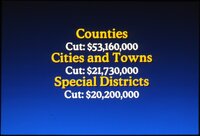 |
Counties, Cities and Towns, Special Districts | 1986; 1987; 1988 | Image/StillImage | uum_map |