| OCR Text |
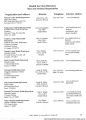
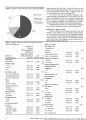
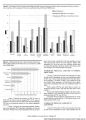
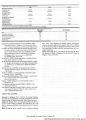
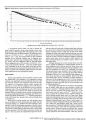
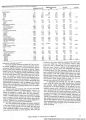
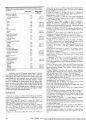
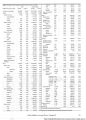
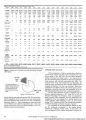
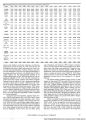
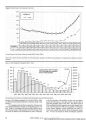
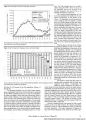
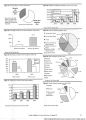
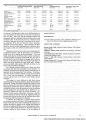
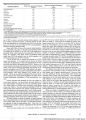
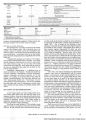
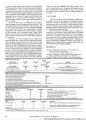
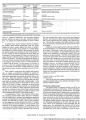
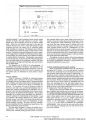
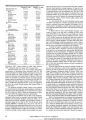
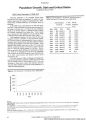
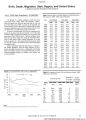
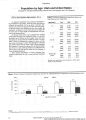
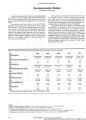
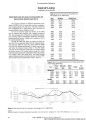
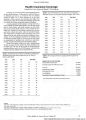
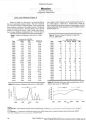
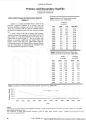
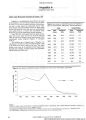
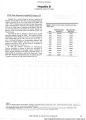
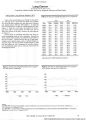
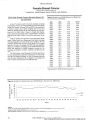
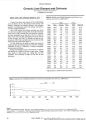
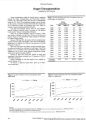
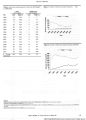
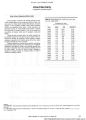
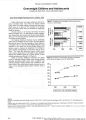
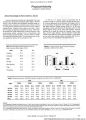
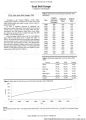
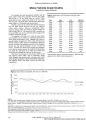
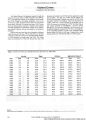
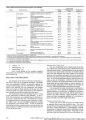
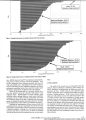
Show Table 4. Race and Ethnicity Data for the State of Utah: 1990 and 2000 Census 1990 Census Total Population by Ethnicity Total Hispanic Total Not Hispanic Total Population Total Population by Race White Black American Indian, Eskimo, or Aleut Asian Native Hawaiian and Other Pacific Islander Other race Total Population Hispanic Origin by Race White Black American Indian, Eskimo, or Aleut Asian or Pacific Islander Other race Total Hispanic Origin Not of Hispanic Origin by Race White Black American Indian, Eskimo, or Aleut Asian or Pacific Islander Other race Total Not Hispanic Count Share 84,597 4.9% 1,638,253 95.1% 1,722,850 100.0% Count Share 1,615,845 93.8% 11,576 0.7% 24,283 1.4% 25,696 1.5% 7,675 0.4% 37,775 2.2% 1,722,850 100.0% 44,591 52.7% 708 0.8% 1,535 1.8% 881 1.0% 36,882 43.6% 84,597 100.0% 2000 Census Total Population by Ethnicity Total Hispanic or Latino Total Not Hispanic or Latino Total Population Total Population by Race White alone Black or African American alone American Indian and Alaska Native alone Asian alone Native Hawaiian and Other Pacific Islander alone Some other race alone Two or more races Hispanic or Latino by Race White alone Black or African American alone American Indian and Alaska Native alone Asian alone Native Hawaiian and Other Pacific Islander alone Some other race alone Two or more races Total Hispanic or Latino Count Share Not Hispanic or Latino by Race 1,571,254 95.9% White alone 10,868 0.7% Black or African American alone 22,748 1.4% American Indian and Alaska Native alone 32,490 2.0% Asian alone 893 0.1% Native Hawaiian and Other Pacific Islander alone 1,638,253 100.0% Some other race alone Two or more races Total Not Hispanic or Latino Count Share 201,559 9.0% 2,031,610 91.0% 2,233,169 100.0% Count Share 1,992,975 89.2% 17,657 0.8% 29,684 1.3% 37,108 1.7% 15,145 0.7% 93,405 4.2% 47,195 2.1% 2,233,169 100.0% 88,710 44.0% 1,520 0.8% 3,021 1.5% 625 0.3% 339 0.2% 91,457 45.4% 15,887 7.9% 201,559 100.0% Count Share 1,904,265 93.7% 16,137 0.8% 26,663 1.3% 36,483 1.8% 14,806 0.7% 1,948 0.1% 31,308 1.5% 2,031,610 100.0% Hispanic or Latino as a Share of "Other Race" 97.6% Hispanic as a Share of "Other Race" 97.9% Source Data: U.S. Bureau of the Census, Bureau of Economic and Business Research (BEBR) Calculations Figure 2. U.S. Foreign Bom Population: 1850 - 2000. 30% 25% 20% 15% 10% 5% 0% Undocumented in 2000 = 7 million or 23% of the foreign born population and 2.5% of the total population. 35 30 lillions) 25 20 o DQ C 15 :oreie 10 4- O 5 mber 28 Utah's Health: An Annual Review Volume DC |