| OCR Text |
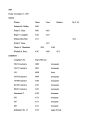
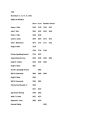
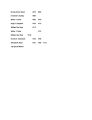
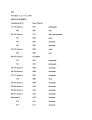
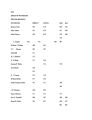
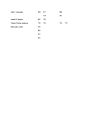
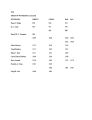
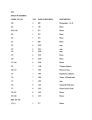
Show 6131 Hoyt- D 4131 concerned, these are straight, typical changes in the bed of the river at the gaging station. Some of the district en-gineers took some periods, and some took others. By Mr. Blackmar: Q Now, this discharge on this Lees Ferry sheet seems to run from 6,210 feet, on November 22, 1924, and the largest shown in 79,200 feet in May of 1926, and all other discharges are in between those two figures; so that it will be fairly representative, will it not? The special Master. Well, we were discussing dates, and not by volume of discharge. The witness. Representative by date and by discharge. The dates so taken as to include minimum and maximum flows, and represent a picture of the condition. The information on Plate 3- A contains the date of the estimate, the engineer who made it, the width, the area, the mean velocity, the gage height, the discharge, and the official number of the measure-ment -- all of which are published by the Geological Survey. By Mr. blackmar: Q Now, in that name exhibit, directing your attention to Plate No. 7, just explain how that may be used in consider- |